Sallie Mae 2008 Annual Report Download - page 36
Download and view the complete annual report
Please find page 36 of the 2008 Sallie Mae annual report below. You can navigate through the pages in the report by either clicking on the pages listed below, or by using the keyword search tool below to find specific information within the annual report.-
 1
1 -
2
-
3
-
4
-
5
-
6
-
7
-
8
-
9
-
10
-
11
-
12
-
13
-
14
-
15
-
16
-
17
-
18
-
19
-
20
-
21
-
22
-
23
-
24
-
25
-
 26
26 -
 27
27 -
 28
28 -
 29
29 -
 30
30 -
 31
31 -
 32
32 -
 33
33 -
 34
34 -
 35
35 -
 36
36 -
 37
37 -
 38
38 -
 39
39 -
 40
40 -
 41
41 -
 42
42 -
 43
43 -
 44
44 -
 45
45 -
 46
46 -
47
-
48
-
49
-
50
-
51
-
52
-
53
-
54
-
55
-
56
-
57
-
58
-
59
-
60
-
61
-
62
-
63
-
64
-
65
-
66
-
67
-
68
-
69
-
70
-
71
-
72
-
73
-
74
-
75
-
76
-
77
-
78
-
79
-
80
-
81
-
82
-
83
-
84
-
85
-
86
-
87
-
88
-
89
-
90
-
91
-
92
-
93
-
94
-
95
-
96
-
97
-
98
-
99
-
100
-
101
-
102
-
103
-
104
-
105
-
106
-
107
-
108
-
109
-
110
-
111
-
112
-
113
-
114
-
115
-
116
-
117
-
118
-
119
-
120
-
121
-
122
-
123
-
124
-
125
-
126
-
127
-
128
-
129
-
130
-
131
-
132
-
133
-
134
-
135
-
136
-
137
-
138
-
139
-
140
-
141
-
142
-
143
-
144
-
145
-
146
-
147
-
148
-
149
-
150
-
151
-
152
-
153
-
154
-
155
-
156
-
157
-
158
-
159
-
160
-
161
-
162
-
163
-
164
-
165
-
166
-
167
-
168
-
169
-
170
-
171
-
172
-
173
-
174
-
175
-
176
-
177
-
178
-
179
-
180
-
181
-
182
-
183
-
184
-
185
-
186
-
187
-
188
-
189
-
190
-
191
-
192
-
193
-
194
-
195
-
196
-
197
-
198
-
199
-
200
-
201
-
202
-
203
-
204
-
205
-
206
-
207
-
208
-
209
-
210
-
211
-
212
-
213
-
214
-
215
-
216
-
217
-
218
-
219
-
220
-
221
-
222
-
223
-
224
-
225
-
226
-
227
-
228
-
229
-
230
-
231
-
232
-
233
-
234
-
235
-
236
-
237
-
238
-
239
-
240
 |
 |
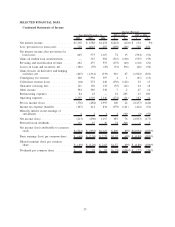
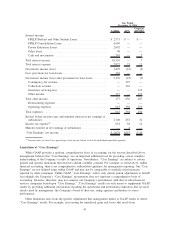
Year Ended December 31, 2008 Compared to Year Ended December 31, 2007
For the year ended December 31, 2008, our net loss was $213 million or $.69 diluted loss per share,
compared to a net loss of $896 million, or $2.26 diluted loss per share, for the year December 31, 2007. The
effective tax rate for those periods was 45 percent and (86) percent, respectively. The movement in the
effective tax rate was primarily driven by the permanent tax impact of excluding non-taxable gains and losses
on equity forward contracts which were marked to market through earnings under SFAS No. 133 in 2007. Pre-
tax loss decreased by $106 million versus the year-ago period primarily due to a decrease in net losses on
derivative and hedging activities from $1.4 billion for the year ended December 31, 2007 to $445 million for
the year ended December 31, 2008, which was primarily a result of the mark-to-market on the equity forward
contracts in the fourth quarter of 2007.
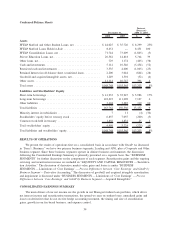
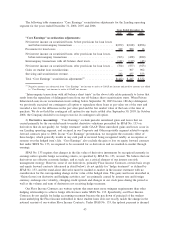
There were no gains on student loan securitizations in the year ended December 31, 2008 compared to
gains of $367 million in the year-ago period. We did not complete any off-balance sheet securitizations in the
year ended December 31, 2008, versus one Private Education Loan securitization in the year-ago period. We
adopted SFAS No. 159, “The Fair Value Option for Financial Assets and Financial Liabilities — Including an
Amendment of FASB Statement No. 115,” on January 1, 2008, and elected the fair value option on all of the
Residual Interests effective January 1, 2008. We made this election in order to simplify the accounting for
Residual Interests by having all Residual Interests under one accounting model. Prior to this election, Residual
Interests were accounted for either under SFAS No. 115, “Accounting for Certain Investments in Debt and
Equity Securities,” with changes in fair value recorded through other comprehensive income or under
SFAS No. 155, “Accounting for Certain Hybrid Financial Instruments,” with changes in fair value recorded
through income. We reclassified the related accumulated other comprehensive income of $195 million into
retained earnings and as a result equity was not impacted at transition on January 1, 2008. Changes in fair
value of Residual Interests on and after January 1, 2008 are recorded through servicing and securitization
income. We have not elected the fair value option for any other financial instruments at this time. Servicing
and securitization revenue decreased by $175 million from $437 million in the year ended December 31, 2007
to $262 million in the year ended December 31, 2008. This decrease was primarily due to a $425 million
unrealized mark-to-market loss recorded under SFAS No. 159 in the current year compared to a $278 million
unrealized mark-to-market loss in the prior year, which included both impairment and an unrealized
mark-to-market gain recorded under SFAS No. 155. The increase in the unrealized mark-to-market loss in
2008 versus 2007 was primarily due to increases in the discount rates used to value the Residual Interests. See
“LIQUIDITY AND CAPITAL RESOURCES — Residual Interest in Securitized Receivables” for further
discussion of the factors impacting the fair values.
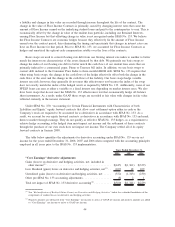
Net interest income after provisions for loan losses increased by $72 million in the year ended
December 31, 2008 from the prior year. This increase was due to a $296 million decrease in provisions for
loan losses, offset by a $224 million decrease in net interest income. The decrease in net interest income was
primarily due to a decrease in the student loan spread (see “LENDING BUSINESS SEGMENT — Net Interest
Income — Net Interest Margin — On-Balance Sheet”), an increase in the 2008 Asset-Backed Financing
Facilities Fees, partially offset by a $25 billion increase in the average balance of on-balance sheet student
loans. The decrease in provisions for loan losses relates to the higher provision amounts in the fourth quarter
of 2007 for Private Education Loans, FFELP loans and mortgage loans, primarily due to a weakening
U.S. economy. The significant provision in the fourth quarter of 2007 primarily related to the non-traditional
portfolio which was particularly impacted by the weakening U.S. economy (see “LENDING BUSINESS
SEGMENT — Private Education Loan Losses — Private Education Loan Delinquencies and Forbearance”
and “— Activity in the Allowance for Private Education Loan Losses”).
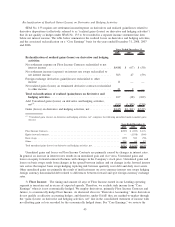
For the year ended December 31, 2008, fee and other income and collections revenue totaled $790 million,
a $359 million decrease from $1.1 billion in the prior year. This decrease was primarily the result of
$368 million of impairment related to both declines in the fair value of mortgage loans and real estate held by
our mortgage purchased paper subsidiary and related to our non-mortgage purchased paper subsidiary recorded
in 2008 compared to $21 million in 2007 (see “ASSET PERFORMANCE GROUP BUSINESS SEGMENT”).
35