Sallie Mae 2008 Annual Report Download - page 126
Download and view the complete annual report
Please find page 126 of the 2008 Sallie Mae annual report below. You can navigate through the pages in the report by either clicking on the pages listed below, or by using the keyword search tool below to find specific information within the annual report.-
 1
1 -
2
-
3
-
4
-
5
-
6
-
7
-
8
-
9
-
10
-
11
-
12
-
13
-
14
-
15
-
16
-
17
-
18
-
19
-
20
-
21
-
22
-
23
-
24
-
25
-
26
-
27
-
28
-
29
-
30
-
31
-
32
-
33
-
34
-
35
-
36
-
37
-
38
-
39
-
40
-
41
-
42
-
43
-
44
-
45
-
46
-
47
-
48
-
49
-
50
-
51
-
52
-
53
-
54
-
55
-
56
-
57
-
58
-
59
-
60
-
61
-
62
-
63
-
64
-
65
-
66
-
67
-
68
-
69
-
70
-
71
-
72
-
73
-
74
-
75
-
76
-
77
-
78
-
79
-
80
-
81
-
82
-
83
-
84
-
85
-
86
-
87
-
88
-
89
-
90
-
91
-
92
-
93
-
94
-
95
-
96
-
97
-
98
-
99
-
100
-
101
-
102
-
103
-
104
-
105
-
106
-
107
-
108
-
109
-
110
-
111
-
112
-
113
-
114
-
115
-
 116
116 -
 117
117 -
 118
118 -
 119
119 -
 120
120 -
 121
121 -
 122
122 -
 123
123 -
 124
124 -
 125
125 -
 126
126 -
 127
127 -
 128
128 -
 129
129 -
 130
130 -
 131
131 -
 132
132 -
 133
133 -
 134
134 -
 135
135 -
 136
136 -
137
-
138
-
139
-
140
-
141
-
142
-
143
-
144
-
145
-
146
-
147
-
148
-
149
-
150
-
151
-
152
-
153
-
154
-
155
-
156
-
157
-
158
-
159
-
160
-
161
-
162
-
163
-
164
-
165
-
166
-
167
-
168
-
169
-
170
-
171
-
172
-
173
-
174
-
175
-
176
-
177
-
178
-
179
-
180
-
181
-
182
-
183
-
184
-
185
-
186
-
187
-
188
-
189
-
190
-
191
-
192
-
193
-
194
-
195
-
196
-
197
-
198
-
199
-
200
-
201
-
202
-
203
-
204
-
205
-
206
-
207
-
208
-
209
-
210
-
211
-
212
-
213
-
214
-
215
-
216
-
217
-
218
-
219
-
220
-
221
-
222
-
223
-
224
-
225
-
226
-
227
-
228
-
229
-
230
-
231
-
232
-
233
-
234
-
235
-
236
-
237
-
238
-
239
-
240
 |
 |

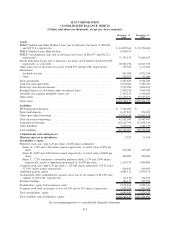
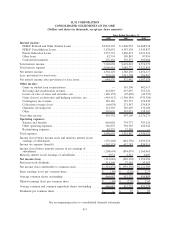
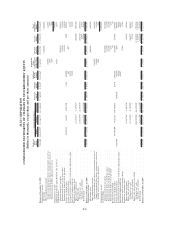
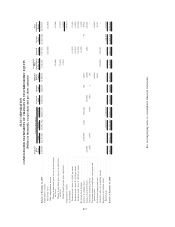
SLM CORPORATION
CONSOLIDATED STATEMENTS OF CHANGES IN STOCKHOLDERS’ EQUITY
(Dollars in thousands, except share and per share amounts)
Preferred
Stock
Shares Issued Treasury Outstanding
Preferred
Stock
Common
Stock
Additional
Paid-In
Capital
Accumulated
Other
Comprehensive
Income (Loss)
Retained
Earnings
Treasury
Stock
Total
Stockholders’
Equity
Common Stock Shares
Balance at December 31, 2005 ..................... 7,300,000 426,483,527 (13,346,717) 413,136,810 $ 565,000 $ 85,297 $2,233,647 $ 367,910 $1,111,743 $ (572,172) $ 3,791,425
Comprehensive income:
Net income ................................ 1,156,956 1,156,956
Other comprehensive income:
Change in unrealized gains (losses) on investments, net of tax . . (41,953) (41,953)
Change in unrealized gains (losses) on derivatives, net of tax. . . 4,990 4,990
Minimum pension liability adjustment, net of tax ........ (569) (569)
Comprehensive income . . . ........................ 1,119,424
Adjustment to initially apply SFAS No. 158, net of tax ........ 18,733 18,733
Cash dividends:
Common stock ($.97 per share) .................... (398,414) (398,414)
Preferred stock, Series A ($3.48 per share) .............. (11,500) (11,500)
Preferred stock, Series B ($5.82 per share) .............. (23,420) (23,420)
Issuance of common shares ........................ 6,629,455 64,141 6,693,596 1,326 204,996 3,499 209,821
Issuance of preferred shares ........................ 647 (647) —
Tax benefit related to employee stock option and purchase plans . . 54,522 54,522
Stock-based compensation cost ...................... 71,399 71,399
Repurchase of common shares:
Open market repurchases ........................ (2,159,827) (2,159,827) (100,000) (100,000)
Equity forwards:
Settlement cost, cash . ........................ (5,395,979) (5,395,979) (295,376) (295,376)
(Gain)/loss on settlement ....................... — — 10,907 10,907
Benefit plans . . . . . . . ........................ (1,657,788) (1,657,788) (87,479) (87,479)
Balance at December 31, 2006 ..................... 7,300,000 433,112,982 (22,496,170) 410,616,812 $ 565,000 $ 86,623 $2,565,211 $ 349,111 $1,834,718 $(1,040,621) $ 4,360,042
Comprehensive income:
Net income (loss) . . . . ........................ (896,394) (896,394)
Other comprehensive income:
Change in unrealized gains (losses) on investments, net of tax . . (101,591) (101,591)
Change in unrealized gains (losses) on derivatives, net of tax. . . (15,004) (15,004)
Defined benefit pension plans adjustment ............. 3,848 3,848
Comprehensive income . . . ........................ (1,009,141)
Cash dividends:
Common stock ($.25 per share) .................... (102,658) (102,658)
Preferred stock, Series A ($3.49 per share) .............. (11,500) (11,500)
Preferred stock, Series B ($6.25 per share) .............. (24,796) (24,796)
Preferred stock, Series C ($.20 per share) .............. (201) (201)
Restricted stock dividend . ........................ (8) (8)
Issuance of common shares ........................ 99,380,099 9,816,534 109,196,633 19,876 1,940,708 (235,548) 423,446 2,148,482
Issuance of preferred shares ........................ 1,000,000 1,000,000 (30,678) (648) 968,674
Tax benefit related to employee stock option and purchase plans . . 49,016 49,016
Stock-based compensation cost ...................... 65,917 65,917
Cumulative effect of accounting change . . ............... (5,761) (5,761)
Repurchase of common shares:
Open market repurchases ........................ (1,809,700) (1,809,700) (65,018) (65,018)
Equity forward settlement:
Settlement cost, cash . ........................ (4,110,929) (4,110,929) (164,437) (164,437)
(Gain)/loss on settlement ....................... — — 54,716 54,716
Equity forwards agreed to be settled:
Settlement cost, cash . ........................ (44,039,890) (44,039,890) (1,992,938) (1,992,938)
(Gain)/loss on settlement ....................... — — 1,105,975 1,105,975
Benefit plans . . . . . . . ........................ (3,311,239) (3,311,239) (152,829) (152,829)
Balance at December 31, 2007 ..................... 8,300,000 532,493,081 (65,951,394) 466,541,687 $1,565,000 $106,499 $4,590,174 $ 236,364 $ 557,204 $(1,831,706) $ 5,223,535
F-6