Sallie Mae 2008 Annual Report Download - page 27
Download and view the complete annual report
Please find page 27 of the 2008 Sallie Mae annual report below. You can navigate through the pages in the report by either clicking on the pages listed below, or by using the keyword search tool below to find specific information within the annual report.-
 1
1 -
2
-
3
-
4
-
5
-
6
-
7
-
8
-
9
-
10
-
11
-
12
-
13
-
14
-
15
-
16
-
 17
17 -
 18
18 -
 19
19 -
 20
20 -
 21
21 -
 22
22 -
 23
23 -
 24
24 -
 25
25 -
 26
26 -
 27
27 -
 28
28 -
 29
29 -
 30
30 -
 31
31 -
 32
32 -
 33
33 -
 34
34 -
 35
35 -
 36
36 -
 37
37 -
38
-
39
-
40
-
41
-
42
-
43
-
44
-
45
-
46
-
47
-
48
-
49
-
50
-
51
-
52
-
53
-
54
-
55
-
56
-
57
-
58
-
59
-
60
-
61
-
62
-
63
-
64
-
65
-
66
-
67
-
68
-
69
-
70
-
71
-
72
-
73
-
74
-
75
-
76
-
77
-
78
-
79
-
80
-
81
-
82
-
83
-
84
-
85
-
86
-
87
-
88
-
89
-
90
-
91
-
92
-
93
-
94
-
95
-
96
-
97
-
98
-
99
-
100
-
101
-
102
-
103
-
104
-
105
-
106
-
107
-
108
-
109
-
110
-
111
-
112
-
113
-
114
-
115
-
116
-
117
-
118
-
119
-
120
-
121
-
122
-
123
-
124
-
125
-
126
-
127
-
128
-
129
-
130
-
131
-
132
-
133
-
134
-
135
-
136
-
137
-
138
-
139
-
140
-
141
-
142
-
143
-
144
-
145
-
146
-
147
-
148
-
149
-
150
-
151
-
152
-
153
-
154
-
155
-
156
-
157
-
158
-
159
-
160
-
161
-
162
-
163
-
164
-
165
-
166
-
167
-
168
-
169
-
170
-
171
-
172
-
173
-
174
-
175
-
176
-
177
-
178
-
179
-
180
-
181
-
182
-
183
-
184
-
185
-
186
-
187
-
188
-
189
-
190
-
191
-
192
-
193
-
194
-
195
-
196
-
197
-
198
-
199
-
200
-
201
-
202
-
203
-
204
-
205
-
206
-
207
-
208
-
209
-
210
-
211
-
212
-
213
-
214
-
215
-
216
-
217
-
218
-
219
-
220
-
221
-
222
-
223
-
224
-
225
-
226
-
227
-
228
-
229
-
230
-
231
-
232
-
233
-
234
-
235
-
236
-
237
-
238
-
239
-
240
 |
 |
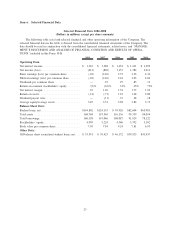
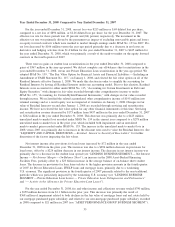
Operating Expenses
Excluding restructuring expenses, fourth quarter 2008 operating expenses on a “Core Earnings” basis
were $270 million, a 26 percent decrease from the year-ago period, exceeding the Company’s 20 percent cost
reduction target. For 2008, operating expenses on a “Core Earnings” basis were $1.3 billion, compared to
$1.4 billion in 2007.
Capital Adequacy
At year end, the Company’s tangible capital ratio was 1.8 percent of Managed assets, compared to
2 percent at 2007 year end. With 81 percent of our Managed loans carrying an explicit federal government
guarantee and with 70 percent of our Managed loans funded for the life of the loan, we currently believe that
our capital levels are appropriate. In the current economic environment, we cannot predict the availability nor
cost of additional capital, should the Company determine that additional capital is necessary.
CRITICAL ACCOUNTING POLICIES AND ESTIMATES
Management’s Discussion and Analysis of Financial Condition and Results of Operations addresses our
consolidated financial statements, which have been prepared in accordance with generally accepted accounting
principles in the United States of America (“GAAP”). Note 2 to the consolidated financial statements,
“Significant Accounting Policies,” includes a summary of the significant accounting policies and methods used
in the preparation of our consolidated financial statements. The preparation of these financial statements
requires management to make estimates and assumptions that affect the reported amounts of assets and
liabilities and the reported amounts of income and expenses during the reporting periods. Actual results may
differ from these estimates under varying assumptions or conditions. On a quarterly basis, management
evaluates its estimates, particularly those that include the most difficult, subjective or complex judgments and
are often about matters that are inherently uncertain. The most significant estimates and assumptions relate to
the following critical accounting policies that are discussed in more detail below.
Allowance for Loan Losses
We maintain an allowance for loan losses at an amount sufficient to absorb losses incurred in our FFELP
loan and Private Education Loan portfolios at the reporting date based on a projection of estimated probable
net credit losses incurred in the portfolio. We analyze those portfolios to determine the effects that the various
stages of delinquency have on borrower default behavior and ultimate net charge-off. We estimate the
allowance for loan losses for our loan portfolio using a migration analysis of delinquent and current accounts.
A migration analysis is a technique used to estimate the likelihood that a loan receivable may progress through
the various delinquency stages and ultimately charge off, net of recoveries, and is a widely used reserving
methodology in the consumer finance industry. We also use the migration analysis to estimate the amount of
uncollectible accrued interest on Private Education Loans and write-off that amount against current period
interest income. The evaluation of the allowance for loan losses is inherently subjective, as it requires material
estimates that may be susceptible to significant changes. Our default estimates are based on a loss
confirmation period of generally two years (i.e., our allowance for loan loss covers the next two years of
expected losses). The two-year estimate of the allowance for loan losses is subject to a number of assumptions.
If actual future performance in delinquency, charge-offs and recoveries are significantly different than
estimated, this could materially affect our estimate of the allowance for loan losses and the related provision
for loan losses on our income statement. We believe that the Private Education Loan and FFELP allowance for
loan losses are appropriate to cover probable losses incurred in the student loan portfolio.
When calculating the allowance for loan losses on Private Education Loans, we divide the portfolio into
categories of similar risk characteristics based on loan program type, loan status (in-school, grace, forbearance,
repayment, and delinquency), underwriting criteria (FICO scores), and existence or absence of a cosigner. As
noted above, we use historical experience of borrower default behavior and charge-offs to estimate the
probable credit losses incurred in the loan portfolio at the reporting date. Also, we use historical borrower
payment behavior to estimate the timing and amount of future recoveries on charged off loans. We then apply
the default and collection rate projections to each category of loans. Once the quantitative calculation is
26