Sallie Mae 2008 Annual Report Download - page 81
Download and view the complete annual report
Please find page 81 of the 2008 Sallie Mae annual report below. You can navigate through the pages in the report by either clicking on the pages listed below, or by using the keyword search tool below to find specific information within the annual report.-
 1
1 -
2
-
3
-
4
-
5
-
6
-
7
-
8
-
9
-
10
-
11
-
12
-
13
-
14
-
15
-
16
-
17
-
18
-
19
-
20
-
21
-
22
-
23
-
24
-
25
-
26
-
27
-
28
-
29
-
30
-
31
-
32
-
33
-
34
-
35
-
36
-
37
-
38
-
39
-
40
-
41
-
42
-
43
-
44
-
45
-
46
-
47
-
48
-
49
-
50
-
51
-
52
-
53
-
54
-
55
-
56
-
57
-
58
-
59
-
60
-
61
-
62
-
63
-
64
-
65
-
66
-
67
-
68
-
69
-
70
-
 71
71 -
 72
72 -
 73
73 -
 74
74 -
 75
75 -
 76
76 -
 77
77 -
 78
78 -
 79
79 -
 80
80 -
 81
81 -
 82
82 -
 83
83 -
 84
84 -
 85
85 -
 86
86 -
 87
87 -
 88
88 -
 89
89 -
 90
90 -
 91
91 -
92
-
93
-
94
-
95
-
96
-
97
-
98
-
99
-
100
-
101
-
102
-
103
-
104
-
105
-
106
-
107
-
108
-
109
-
110
-
111
-
112
-
113
-
114
-
115
-
116
-
117
-
118
-
119
-
120
-
121
-
122
-
123
-
124
-
125
-
126
-
127
-
128
-
129
-
130
-
131
-
132
-
133
-
134
-
135
-
136
-
137
-
138
-
139
-
140
-
141
-
142
-
143
-
144
-
145
-
146
-
147
-
148
-
149
-
150
-
151
-
152
-
153
-
154
-
155
-
156
-
157
-
158
-
159
-
160
-
161
-
162
-
163
-
164
-
165
-
166
-
167
-
168
-
169
-
170
-
171
-
172
-
173
-
174
-
175
-
176
-
177
-
178
-
179
-
180
-
181
-
182
-
183
-
184
-
185
-
186
-
187
-
188
-
189
-
190
-
191
-
192
-
193
-
194
-
195
-
196
-
197
-
198
-
199
-
200
-
201
-
202
-
203
-
204
-
205
-
206
-
207
-
208
-
209
-
210
-
211
-
212
-
213
-
214
-
215
-
216
-
217
-
218
-
219
-
220
-
221
-
222
-
223
-
224
-
225
-
226
-
227
-
228
-
229
-
230
-
231
-
232
-
233
-
234
-
235
-
236
-
237
-
238
-
239
-
240
 |
 |

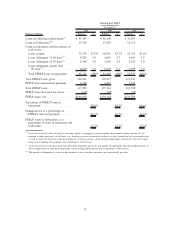
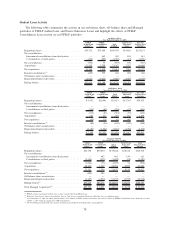
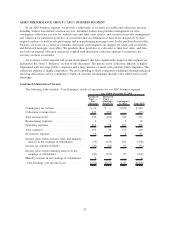
FFELP
Stafford
and
Other
(1)
FFELP
Consolidation
Loans
Total
FFELP
Total
Private
Education
Loans
Total On-
Balance Sheet
Portfolio
On-Balance Sheet
Year Ended December 31, 2006
Beginning balance . . ............................. $19,988 $54,859 $ 74,847 $ 7,757 $ 82,604
Net consolidations:
Incremental consolidations from third parties . . . ......... — 4,092 4,092 96 4,188
Consolidations to third parties . . . ................... (2,201) (2,078) (4,279) (14) (4,293)
Net consolidations . . ............................. (2,201) 2,014 (187) 82 (105)
Acquisitions . .................................. 19,585 4,697 24,282 7,818 32,100
Net acquisitions................................. 17,384 6,711 24,095 7,900 31,995
Internal consolidations ............................ (5,973) 11,931 5,958 254 6,212
Off-balance sheet securitizations . . . ................... (5,034) (9,638) (14,672) (4,737) (19,409)
Repayments/claims/resales/other . . . ................... (1,524) (2,539) (4,063) (1,419) (5,482)
Ending balance ................................. $24,841 $61,324 $ 86,165 $ 9,755 $ 95,920
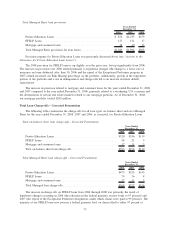
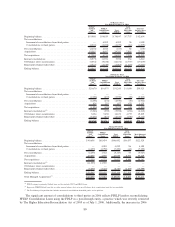
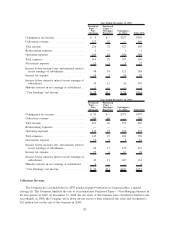
FFELP
Stafford
and
Other
(1)
FFELP
Consolidation
Loans
Total
FFELP
Total
Private
Education
Loans
Total Off-
Balance Sheet
Portfolio
Off-Balance Sheet
Year Ended December 31, 2006
Beginning balance . . ............................. $20,670 $10,575 $31,245 $ 8,680 $39,925
Net consolidations:
Incremental consolidations from third parties............. — — — — —
Consolidations to third parties . . . ................... (2,258) (672) (2,930) (32) (2,962)
Net consolidations . . ............................. (2,258) (672) (2,930) (32) (2,962)
Acquisitions . .................................. 424 233 657 472 1,129
Net acquisitions ................................. (1,834) (439) (2,273) 440 (1,833)
Internal consolidations
(2)
........................... (5,366) (592) (5,958) (254) (6,212)
Off-balance sheet securitizations . . . ................... 5,034 9,638 14,672 4,737 19,409
Repayments/claims/resales/other . . . ................... (3,476) (871) (4,347) (770) (5,117)
Ending balance ................................. $15,028 $18,311 $33,339 $12,833 $46,172
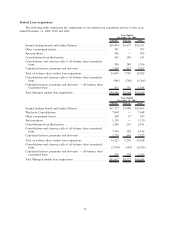
FFELP
Stafford
and
Other
(1)
FFELP
Consolidation
Loans
Total
FFELP
Total
Private
Education
Loans
Total Managed
Basis Portfolio
Managed Portfolio
Year Ended December 31, 2006
Beginning balance. . ............................ $40,658 $65,434 $106,092 $16,437 $122,529
Net consolidations:
Incremental consolidations from third parties . . . ........ — 4,092 4,092 96 4,188
Consolidations to third parties . . .................. (4,459) (2,750) (7,209) (46) (7,255)
Net consolidations. . ............................ (4,459) 1,342 (3,117) 50 (3,067)
Acquisitions. ................................. 20,009 4,930 24,939 8,290 33,229
Net acquisitions . . . ............................ 15,550 6,272 21,822 8,340 30,162
Internal consolidations
(2)
......................... (11,339) 11,339 — — —
Off-balance sheet securitizations . . .................. — — — — —
Repayments/claims/resales/other. . . .................. (5,000) (3,410) (8,410) (2,189) (10,599)
Ending balance ................................ $39,869 $79,635 $119,504 $22,588 $142,092
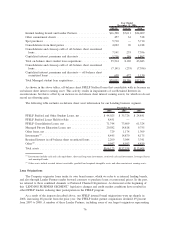
Total Managed Acquisitions
(3)
...................... $20,009 $ 9,022 $ 29,031 $ 8,386 $ 37,417
(1)
FFELP category is primarily Stafford loans and also includes PLUS and HEAL loans.
(2)
Represents FFELP/Stafford loans that we either own on-balance sheet or in our off-balance sheet securitization trusts that we consolidate.
(3)
The Total Managed Acquisitions line includes incremental consolidations from third parties and acquisitions.
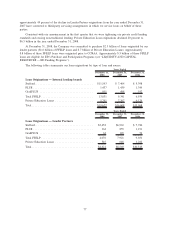
The significant amount of consolidations to third parties in 2006 reflects FFELP lenders reconsolidating
FFELP Consolidation Loans using the FDLP as a pass-through entity, a practice which was severely restricted
by The Higher Education Reconciliation Act of 2005 as of July 1, 2006. Additionally, the increases in 2006
80