Sallie Mae 2008 Annual Report Download - page 101
Download and view the complete annual report
Please find page 101 of the 2008 Sallie Mae annual report below. You can navigate through the pages in the report by either clicking on the pages listed below, or by using the keyword search tool below to find specific information within the annual report.-
 1
1 -
2
-
3
-
4
-
5
-
6
-
7
-
8
-
9
-
10
-
11
-
12
-
13
-
14
-
15
-
16
-
17
-
18
-
19
-
20
-
21
-
22
-
23
-
24
-
25
-
26
-
27
-
28
-
29
-
30
-
31
-
32
-
33
-
34
-
35
-
36
-
37
-
38
-
39
-
40
-
41
-
42
-
43
-
44
-
45
-
46
-
47
-
48
-
49
-
50
-
51
-
52
-
53
-
54
-
55
-
56
-
57
-
58
-
59
-
60
-
61
-
62
-
63
-
64
-
65
-
66
-
67
-
68
-
69
-
70
-
71
-
72
-
73
-
74
-
75
-
76
-
77
-
78
-
79
-
80
-
81
-
82
-
83
-
84
-
85
-
86
-
87
-
88
-
89
-
90
-
 91
91 -
 92
92 -
 93
93 -
 94
94 -
 95
95 -
 96
96 -
 97
97 -
 98
98 -
 99
99 -
 100
100 -
 101
101 -
 102
102 -
 103
103 -
 104
104 -
 105
105 -
 106
106 -
 107
107 -
 108
108 -
 109
109 -
 110
110 -
 111
111 -
112
-
113
-
114
-
115
-
116
-
117
-
118
-
119
-
120
-
121
-
122
-
123
-
124
-
125
-
126
-
127
-
128
-
129
-
130
-
131
-
132
-
133
-
134
-
135
-
136
-
137
-
138
-
139
-
140
-
141
-
142
-
143
-
144
-
145
-
146
-
147
-
148
-
149
-
150
-
151
-
152
-
153
-
154
-
155
-
156
-
157
-
158
-
159
-
160
-
161
-
162
-
163
-
164
-
165
-
166
-
167
-
168
-
169
-
170
-
171
-
172
-
173
-
174
-
175
-
176
-
177
-
178
-
179
-
180
-
181
-
182
-
183
-
184
-
185
-
186
-
187
-
188
-
189
-
190
-
191
-
192
-
193
-
194
-
195
-
196
-
197
-
198
-
199
-
200
-
201
-
202
-
203
-
204
-
205
-
206
-
207
-
208
-
209
-
210
-
211
-
212
-
213
-
214
-
215
-
216
-
217
-
218
-
219
-
220
-
221
-
222
-
223
-
224
-
225
-
226
-
227
-
228
-
229
-
230
-
231
-
232
-
233
-
234
-
235
-
236
-
237
-
238
-
239
-
240
 |
 |

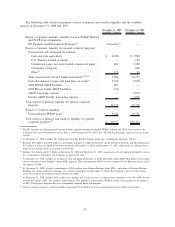
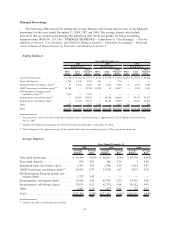
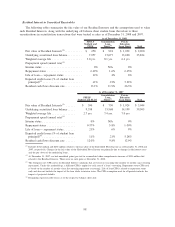
The following table summarizes the components of servicing and securitization revenue for the years
ended December 31, 2008, 2007 and 2006.
2008 2007 2006
Years Ended December 31,
Servicing revenue ..................................... $ 247 $ 285 $ 336
Securitization revenue, before Net Embedded Floor Income,
impairment and unrealized fair value adjustment ............. 323 419 368
Servicing and securitization revenue, before Net Embedded Floor
Income, impairment and unrealized fair value adjustment ...... 570 704 704
Embedded Floor Income ................................ 191 20 14
Less: Floor Income previously recognized in gain calculation ..... (76) (9) (8)
Net Embedded Floor Income ............................. 115 11 6
Servicing and securitization revenue, before impairment and
unrealized fair value adjustment ......................... 685 715 710
Gain/(loss) on consolidation of off-balance sheet trusts .......... 2 — —
Unrealized fair value adjustment .......................... (425) (24) —
Retained Interest impairment ............................. — (254) (157)
Total servicing and securitization revenue .................... $ 262 $ 437 $ 553
Average off-balance sheet student loans ..................... $37,586 $42,411 $46,336
Average balance of Retained Interest ....................... $ 2,596 $ 3,385 $ 3,101
Servicing and securitization revenue as a percentage of the average
balance of off-balance sheet student loans .................. .70% 1.03% 1.19%
Servicing and securitization revenue is primarily driven by the average balance of off-balance sheet
student loans, the amount of and the difference in the timing of Embedded Floor Income recognition on off-
balance sheet student loans and the fair value adjustment related to those Residual Interests where the
Company has elected to carry such Residual Interests at fair value through earnings under SFAS No. 159.
The Company adopted SFAS No. 159 on January 1, 2008, and has elected the fair value option on all of
the Residual Interests effective January 1, 2008. The Company chose this election in order to record all
Residual Interests under one accounting model. Prior to this election, Residual Interests were accounted for
either under SFAS No. 115 with changes in fair value recorded through other comprehensive income, except if
impaired in which case changes in fair value were recorded through income, or under SFAS No. 155 with all
changes in fair value recorded through income. Changes in the fair value of Residual Interests from January 1,
2008 forward are recorded in the servicing and securitization revenue line item of the consolidated income
statement.
As of December 31, 2008, the Company had changed the following significant assumptions compared to
those used as of December 31, 2007, to determine the fair value of the Residual Interests:
• Prepayment speed assumptions were decreased for all three asset types primarily as a result of a
significant reduction in prepayment activity experienced which is expected to continue into the
foreseeable future. The decrease in prepayment speeds is primarily due to a reduction in third-party
consolidation activity as a result of the CCRAA (for FFELP only) and the current U.S. economic and
credit environment. This resulted in a $114 million unrealized mark-to-market gain.
• Life of loan default rate assumptions for Private Education loans were increased as a result of the
continued weakening of the U.S. economy. This resulted in a $79 million unrealized mark-to-market
loss.
100