Sallie Mae 2008 Annual Report Download - page 213
Download and view the complete annual report
Please find page 213 of the 2008 Sallie Mae annual report below. You can navigate through the pages in the report by either clicking on the pages listed below, or by using the keyword search tool below to find specific information within the annual report.-
 1
1 -
2
-
3
-
4
-
5
-
6
-
7
-
8
-
9
-
10
-
11
-
12
-
13
-
14
-
15
-
16
-
17
-
18
-
19
-
20
-
21
-
22
-
23
-
24
-
25
-
26
-
27
-
28
-
29
-
30
-
31
-
32
-
33
-
34
-
35
-
36
-
37
-
38
-
39
-
40
-
41
-
42
-
43
-
44
-
45
-
46
-
47
-
48
-
49
-
50
-
51
-
52
-
53
-
54
-
55
-
56
-
57
-
58
-
59
-
60
-
61
-
62
-
63
-
64
-
65
-
66
-
67
-
68
-
69
-
70
-
71
-
72
-
73
-
74
-
75
-
76
-
77
-
78
-
79
-
80
-
81
-
82
-
83
-
84
-
85
-
86
-
87
-
88
-
89
-
90
-
91
-
92
-
93
-
94
-
95
-
96
-
97
-
98
-
99
-
100
-
101
-
102
-
103
-
104
-
105
-
106
-
107
-
108
-
109
-
110
-
111
-
112
-
113
-
114
-
115
-
116
-
117
-
118
-
119
-
120
-
121
-
122
-
123
-
124
-
125
-
126
-
127
-
128
-
129
-
130
-
131
-
132
-
133
-
134
-
135
-
136
-
137
-
138
-
139
-
140
-
141
-
142
-
143
-
144
-
145
-
146
-
147
-
148
-
149
-
150
-
151
-
152
-
153
-
154
-
155
-
156
-
157
-
158
-
159
-
160
-
161
-
162
-
163
-
164
-
165
-
166
-
167
-
168
-
169
-
170
-
171
-
172
-
173
-
174
-
175
-
176
-
177
-
178
-
179
-
180
-
181
-
182
-
183
-
184
-
185
-
186
-
187
-
188
-
189
-
190
-
191
-
192
-
193
-
194
-
195
-
196
-
197
-
198
-
199
-
200
-
201
-
202
-
 203
203 -
 204
204 -
 205
205 -
 206
206 -
 207
207 -
 208
208 -
 209
209 -
 210
210 -
 211
211 -
 212
212 -
 213
213 -
 214
214 -
 215
215 -
 216
216 -
 217
217 -
 218
218 -
 219
219 -
 220
220 -
 221
221 -
 222
222 -
 223
223 -
224
-
225
-
226
-
227
-
228
-
229
-
230
-
231
-
232
-
233
-
234
-
235
-
236
-
237
-
238
-
239
-
240
 |
 |

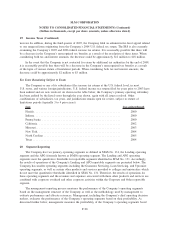
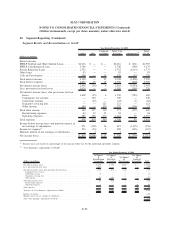
20. Segment Reporting (Continued)
Segment Results and Reconciliations to GAAP
Lending APG
Corporate
and Other
Total “Core
Earnings” Adjustments
(2)
Total
GAAP
Year Ended December 31, 2008
(Dollars in millions)
Interest income:
FFELP Stafford and Other Student Loans . . . . . . . . $2,216 $ — $ — $2,216 $ (221) $1,995
FFELP Consolidation Loans. . . . . . . . . . . . . . . . . . 3,748 — — 3,748 (569) 3,179
Private Education Loans . . . . . . . . . . . . . . . . . . . . 2,752 — — 2,752 (1,015) 1,737
Other loans . . . . . . . . . . . . . . . . . . . . . . . . . . . . . 83 — — 83 — 83
Cash and investments . . . . . . . . . . . . . . . . . . . . . . 304 — 25 329 (53) 276
Total interest income . . . . . . . . . . . . . . . . . . . . . . . 9,103 — 25 9,128 (1,858) 7,270
Total interest expense . . . . . . . . . . . . . . . . . . . . . . 6,665 25 19 6,709 (804) 5,905
Net interest income (loss) . . . . . . . . . . . . . . . . . . . 2,438 (25) 6 2,419 (1,054) 1,365
Less: provisions for loan losses . . . . . . . . . . . . . . . 1,029 — — 1,029 (309) 720
Net interest income (loss) after provisions for loan
losses. . . . . . . . . . . . . . . . . . . . . . . . . . . . . . . . 1,409 (25) 6 1,390 (745) 645
Contingency fee revenue . . . . . . . . . . . . . . . . . . — 340 — 340 — 340
Collections revenue . . . . . . . . . . . . . . . . . . . . . . — (63) — (63) (1) (64)
Guarantor servicing fees. . . . . . . . . . . . . . . . . . . — — 121 121 — 121
Otherincome .......................... 180 — 199 379 (356) 23
Total other income . . . . . . . . . . . . . . . . . . . . . . . . 180 277 320 777 (357) 420
Restructuring expenses. . . . . . . . . . . . . . . . . . . . 49 12 23 84 — 84
Operating expenses . . . . . . . . . . . . . . . . . . . . . . 589 398 277 1,264 93 1,357
Total expenses . . . . . . . . . . . . . . . . . . . . . . . . . . . 638 410 300 1,348 93 1,441
Income before income taxes and minority interest in
net earnings of subsidiaries . . . . . . . . . . . . . . . . . 951 (158) 26 819 (1,195) (376)
Income tax expense
(1)
. . . . . . . . . . . . . . . . . . . . . . 336 (56) 9 289 (456) (167)
Minority interest in net earnings of subsidiaries . . . . — 4 — 4 — 4
Net income (loss) . . . . . . . . . . . . . . . . . . . . . . . . . $ 615 $(106) $ 17 $ 526 $ (739) $ (213)
(1)
Income taxes are based on a percentage of net income before tax for the individual reportable segment.
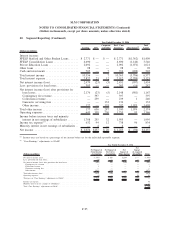
(2)
“Core Earnings” adjustments to GAAP:
(Dollars in millions)
Net Impact
of
Securitization
Accounting
Net Impact
of
Derivative
Accounting
Net Impact
of
Floor Income
Net Impact
of
Acquired
Intangibles Total
Year Ended December 31, 2008
Net interest income (loss) . . . . . . . . . . . . . . . . . . . . . . . . . . . . . . . . . . . . $(837) $(115) $(102) $ — $(1,054)
Less: provisions for loan losses . . . . . . . . . . . . . . . . . . . . . . . . . . . . . . . . . (309) — — — (309)
Net interest income (loss) after provisions for loan losses . . . . . . . . . . . . . . . . . . (528) (115) (102) — (745)
Contingency fee revenue. . . . . . . . . . . . . . . . . . . . . . . . . . . . . . . . . . . . — — — — —
Collections revenue . . . . . . . . . . . . . . . . . . . . . . . . . . . . . . . . . . . . . . (1) — — — (1)
Guarantor servicing fees . . . . . . . . . . . . . . . . . . . . . . . . . . . . . . . . . . . . — — — — —
Other income . . . . . . . . . . . . . . . . . . . . . . . . . . . . . . . . . . . . . . . . . . 89 (445) — — (356)
Total other income (loss) . . . . . . . . . . . . . . . . . . . . . . . . . . . . . . . . . . . . . 88 (445) — — (357)
Restructuring expenses. . . . . . . . . . . . . . . . . . . . . . . . . . . . . . . . . . . . . — — — — —
Operating expenses . . . . . . . . . . . . . . . . . . . . . . . . . . . . . . . . . . . . . . . 2 — — 91 93
Total expenses . . . . . . . . . . . . . . . . . . . . . . . . . . . . . . . . . . . . . . . . . . . 2 — — 91 93
Total pre-tax “Core Earnings” adjustments to GAAP . . . . . . . . . . . . . . . . . . . . . $(442) $(560) $(102) $(91) (1,195)
Income tax expense . . . . . . . . . . . . . . . . . . . . . . . . . . . . . . . . . . . . . . . . (456)
Minority interest in net earnings of subsidiaries . . . . . . . . . . . . . . . . . . . . . . . . —
Total “Core Earnings” adjustments to GAAP . . . . . . . . . . . . . . . . . . . . . . . . . $ (739)
F-93
SLM CORPORATION
NOTES TO CONSOLIDATED FINANCIAL STATEMENTS (Continued)
(Dollars in thousands, except per share amounts, unless otherwise stated)