Sallie Mae 2008 Annual Report Download - page 8
Download and view the complete annual report
Please find page 8 of the 2008 Sallie Mae annual report below. You can navigate through the pages in the report by either clicking on the pages listed below, or by using the keyword search tool below to find specific information within the annual report.-
 1
1 -
 2
2 -
 3
3 -
 4
4 -
 5
5 -
 6
6 -
 7
7 -
 8
8 -
 9
9 -
 10
10 -
 11
11 -
 12
12 -
 13
13 -
 14
14 -
 15
15 -
 16
16 -
 17
17 -
 18
18 -
 19
19 -
20
-
21
-
22
-
23
-
24
-
25
-
26
-
27
-
28
-
29
-
30
-
31
-
32
-
33
-
34
-
35
-
36
-
37
-
38
-
39
-
40
-
41
-
42
-
43
-
44
-
45
-
46
-
47
-
48
-
49
-
50
-
51
-
52
-
53
-
54
-
55
-
56
-
57
-
58
-
59
-
60
-
61
-
62
-
63
-
64
-
65
-
66
-
67
-
68
-
69
-
70
-
71
-
72
-
73
-
74
-
75
-
76
-
77
-
78
-
79
-
80
-
81
-
82
-
83
-
84
-
85
-
86
-
87
-
88
-
89
-
90
-
91
-
92
-
93
-
94
-
95
-
96
-
97
-
98
-
99
-
100
-
101
-
102
-
103
-
104
-
105
-
106
-
107
-
108
-
109
-
110
-
111
-
112
-
113
-
114
-
115
-
116
-
117
-
118
-
119
-
120
-
121
-
122
-
123
-
124
-
125
-
126
-
127
-
128
-
129
-
130
-
131
-
132
-
133
-
134
-
135
-
136
-
137
-
138
-
139
-
140
-
141
-
142
-
143
-
144
-
145
-
146
-
147
-
148
-
149
-
150
-
151
-
152
-
153
-
154
-
155
-
156
-
157
-
158
-
159
-
160
-
161
-
162
-
163
-
164
-
165
-
166
-
167
-
168
-
169
-
170
-
171
-
172
-
173
-
174
-
175
-
176
-
177
-
178
-
179
-
180
-
181
-
182
-
183
-
184
-
185
-
186
-
187
-
188
-
189
-
190
-
191
-
192
-
193
-
194
-
195
-
196
-
197
-
198
-
199
-
200
-
201
-
202
-
203
-
204
-
205
-
206
-
207
-
208
-
209
-
210
-
211
-
212
-
213
-
214
-
215
-
216
-
217
-
218
-
219
-
220
-
221
-
222
-
223
-
224
-
225
-
226
-
227
-
228
-
229
-
230
-
231
-
232
-
233
-
234
-
235
-
236
-
237
-
238
-
239
-
240
 |
 |
LENDING BUSINESS SEGMENT
In the Lending business segment, we originate and acquire both federally guaranteed student loans, which
are administered by ED, and Private Education Loans, which are not federally guaranteed. Most of our
borrowers use Private Education Loans primarily to supplement federally guaranteed loans in meeting the cost
of education. We manage the largest portfolio of FFELP and Private Education Loans in the student loan
industry, and have 10 million student and parent customers through our ownership and management of
$180.4 billion in Managed student loans as of December 31, 2008, of which $147.0 billion or 81 percent are
federally insured. We serve over 6,000 clients including educational and financial institutions and state
agencies. We are the largest servicer of student loans, servicing a portfolio of $139 billion of FFELP loans and
$39 billion of Private Education Loans as of December 31, 2008.
Sallie Mae’s Lending Business
Our primary marketing point-of-contact is the school’s financial aid office. We deliver flexible and cost-
effective products to the school and its students. The focus of our sales force is to market Sallie Mae’s suite of
education finance products and business office solutions to colleges. These include FFELP and Private
Education Loans and our Web-based loan origination and servicing platform OpenNet». Simply put, our
strategy is to provide the financial aid and bursar’s office with the tools they need to provide their students
with the financing students require to pay for their education.
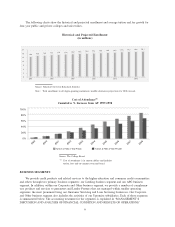
In 2008, we originated $24.2 billion in student loans. FFELP originations for the year ended December 31,
2008 totaled $17.9 billion, an increase of 4 percent from the year ended December 31, 2007. The slowdown in
FFELP loan origination growth is due principally to a large decline in loan originations through Lender
Partners as a result of the diminished profitability of FFELP loans discussed earlier. Private Education Loan
originations totaled $6.3 billion, a decrease of 20 percent from the prior year. The decline in Private Education
Loan originations is due to our elimination of non-traditional lending announced earlier in the year and
funding pressures which required us to limit our Private Education lending activities.
In the past we relied on Lender Partners, typically national or regional banks, for a large percentage of
our loan originations. Our sales force promoted their brands on campuses and we purchased the loans after
disbursement. In recent years, we migrated away from this strategy due to the stronger profitability of our
internal brands. The increased pressures on the profitability of student loans described above accelerated this
shift. In 2007, 34 percent of our loan originations were from Lender Partners. For 2008, lender partner
originations declined to 19 percent of total loan originations. They were just 10 percent in the fourth quarter.
The Company believes that the contribution to total loan originations from Lender Partners will be immaterial
in future years.
Growth in FFELP lending is expected to come from loan limit increases and capturing market share as
other participants exit the sector (see APPENDIX A, “FEDERAL FAMILY EDUCATION LOAN PRO-
GRAM,” for a discussion of the history of student loan limits). In addition, the sharp contraction in household
wealth is expected to increase the use of both federal and Private Education Loan programs. Offsetting these
factors is an expected increase in participation in the FDLP. The FDLP program, with a market share of
20 percent in FFY 2007, had consistently lost market share since it peaked in FFY 1997 at 34 percent. In
2008, this trend reversed for the first time in over a decade due to the events described above and FDLP’s
market share rose to 24 percent.
In recent years, consolidation loans were an integral part of the FFELP business. Students were able to
fix their interest rate for twenty years or more. Very low interest rates persisted in the early part of this decade,
resulting in high levels of loan consolidation. At the end of 2008, 63 percent of our average Managed FFELP
loans were consolidation loans, down from 67 percent at the end of 2007. The CCRAA made consolidation
loans virtually unprofitable; it also removed the interest rate incentive for borrowers to consolidate their loans.
As a result, we no longer offer this product.
7