Sallie Mae 2008 Annual Report Download - page 108
Download and view the complete annual report
Please find page 108 of the 2008 Sallie Mae annual report below. You can navigate through the pages in the report by either clicking on the pages listed below, or by using the keyword search tool below to find specific information within the annual report.-
 1
1 -
2
-
3
-
4
-
5
-
6
-
7
-
8
-
9
-
10
-
11
-
12
-
13
-
14
-
15
-
16
-
17
-
18
-
19
-
20
-
21
-
22
-
23
-
24
-
25
-
26
-
27
-
28
-
29
-
30
-
31
-
32
-
33
-
34
-
35
-
36
-
37
-
38
-
39
-
40
-
41
-
42
-
43
-
44
-
45
-
46
-
47
-
48
-
49
-
50
-
51
-
52
-
53
-
54
-
55
-
56
-
57
-
58
-
59
-
60
-
61
-
62
-
63
-
64
-
65
-
66
-
67
-
68
-
69
-
70
-
71
-
72
-
73
-
74
-
75
-
76
-
77
-
78
-
79
-
80
-
81
-
82
-
83
-
84
-
85
-
86
-
87
-
88
-
89
-
90
-
91
-
92
-
93
-
94
-
95
-
96
-
97
-
 98
98 -
 99
99 -
 100
100 -
 101
101 -
 102
102 -
 103
103 -
 104
104 -
 105
105 -
 106
106 -
 107
107 -
 108
108 -
 109
109 -
 110
110 -
 111
111 -
 112
112 -
 113
113 -
 114
114 -
 115
115 -
 116
116 -
 117
117 -
 118
118 -
119
-
120
-
121
-
122
-
123
-
124
-
125
-
126
-
127
-
128
-
129
-
130
-
131
-
132
-
133
-
134
-
135
-
136
-
137
-
138
-
139
-
140
-
141
-
142
-
143
-
144
-
145
-
146
-
147
-
148
-
149
-
150
-
151
-
152
-
153
-
154
-
155
-
156
-
157
-
158
-
159
-
160
-
161
-
162
-
163
-
164
-
165
-
166
-
167
-
168
-
169
-
170
-
171
-
172
-
173
-
174
-
175
-
176
-
177
-
178
-
179
-
180
-
181
-
182
-
183
-
184
-
185
-
186
-
187
-
188
-
189
-
190
-
191
-
192
-
193
-
194
-
195
-
196
-
197
-
198
-
199
-
200
-
201
-
202
-
203
-
204
-
205
-
206
-
207
-
208
-
209
-
210
-
211
-
212
-
213
-
214
-
215
-
216
-
217
-
218
-
219
-
220
-
221
-
222
-
223
-
224
-
225
-
226
-
227
-
228
-
229
-
230
-
231
-
232
-
233
-
234
-
235
-
236
-
237
-
238
-
239
-
240
 |
 |

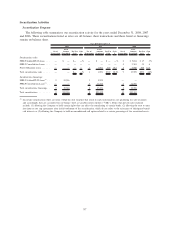
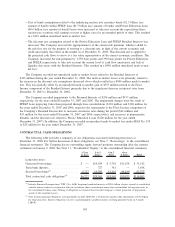
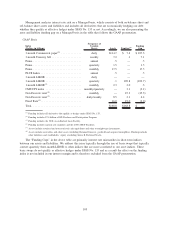
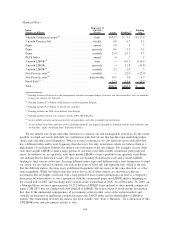
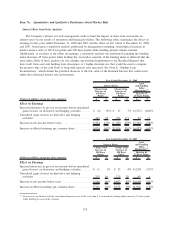
When compared with the GAAP presentation, the Managed basis presentation includes all of our off-
balance sheet assets and funding, and also includes basis swaps that primarily convert quarterly three-month
LIBOR to other indices that are more correlated to our asset indices.
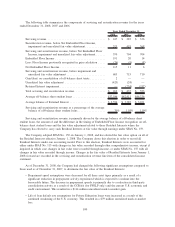
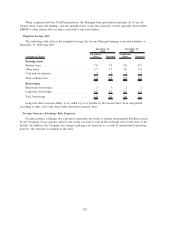
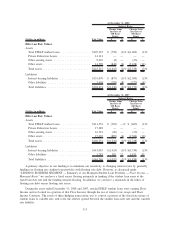
Weighted Average Life
The following table reflects the weighted average life for our Managed earning assets and liabilities at
December 31, 2008 and 2007.
(Averages in Years)
On-Balance
Sheet Managed
On-Balance
Sheet Managed
December 31,
2008
December 31,
2007
Earning assets
Student loans ............................. 7.8 7.9 9.0 8.9
Other loans ............................... 5.7 5.7 5.0 5.0
Cash and investments ....................... .2 .1 .2 .2
Total earning assets ......................... 7.4 7.5 8.0 8.0
Borrowings
Short-term borrowings....................... .3 .3 .2 .2
Long-term borrowings....................... 6.8 6.7 6.6 6.4
Total borrowings ........................... 5.0 5.3 5.0 5.2
Long-term debt issuances likely to be called by us or putable by the investor have been categorized
according to their call or put dates rather than their maturity dates.
Foreign Currency Exchange Rate Exposure
Foreign currency exchange rate exposure is primarily the result of foreign denominated liabilities issued
by the Company. Cross-currency interest rate swaps are used to lock-in the exchange rate for the term of the
liability. In addition, the Company has foreign exchange rate exposure as a result of international operations;
however, the exposure is minimal at this time.
107