Sallie Mae 2008 Annual Report Download - page 177
Download and view the complete annual report
Please find page 177 of the 2008 Sallie Mae annual report below. You can navigate through the pages in the report by either clicking on the pages listed below, or by using the keyword search tool below to find specific information within the annual report.
8. Student Loan Securitization (Continued)
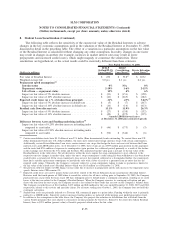
The following table summarizes charge-off activity for Private Education Loans in the off-balance sheet
trusts for the years ended December 31, 2008, 2007 and 2006 as corrected and discussed above in Note 4,
“Allowance for Loan Losses.”
(Dollars in millions) 2008 2007 2006
Years Ended December 31,
Charge-offs .......................................... (153) (79) (24)
Charge-offs as a percentage of average loans in repayment ....... 1.90% 1.09% .43%
Charge-offs as a percentage of average loans in repayment and
forbearance ........................................ 1.64% .94% .38%
Ending off-balance sheet total Private Education Loans
(1)
........ $13,782 $14,227 $13,222
Average off-balance sheet Private Education Loans in repayment . . $ 8,088 $ 7,305 $ 5,721
Ending off-balance sheet Private Education Loans in repayment . . . $ 9,530 $ 7,819 $ 6,792
(1)
Ending total loans represents gross Private Education Loans, plus the receivable for partially charged-off loans.
9. Derivative Financial Instruments
Risk Management Strategy
The Company maintains an overall interest rate risk management strategy that incorporates the use of
derivative instruments to minimize the economic effect of interest rate changes. The Company’s goal is to
manage interest rate sensitivity by modifying the repricing frequency and underlying index characteristics of
certain balance sheet assets and liabilities (including the Residual Interest from off-balance sheet securitiza-
tions) so that the net interest margin is not, on a material basis, adversely affected by movements in interest
rates. The Company does not use derivative instruments to hedge credit risk associated with debt issued by the
Company. As a result of interest rate fluctuations, hedged assets and liabilities will appreciate or depreciate in
market value. Income or loss on the derivative instruments that are linked to the hedged assets and liabilities
will generally offset the effect of this unrealized appreciation or depreciation for the period the item is being
hedged. The Company views this strategy as a prudent management of interest rate sensitivity. In addition, the
Company utilizes derivative contracts to minimize the economic impact of changes in foreign currency
exchange rates on certain debt obligations that are denominated in foreign currencies. As foreign currency
exchange rates fluctuate, these liabilities will appreciate and depreciate in value. These fluctuations, to the
extent the hedge relationship is effective, are offset by changes in the value of the cross-currency interest rate
swaps executed to hedge these instruments. Management believes certain derivative transactions entered into
as hedges, primarily Floor Income Contracts, basis swaps and Eurodollar futures contracts, are economically
effective; however, those transactions generally do not qualify for hedge accounting under SFAS No. 133 (as
discussed below) and thus may adversely impact earnings.
Although the Company uses derivatives to offset (or minimize) the risk of interest rate and foreign
currency changes, the use of derivatives does expose the Company to both market and credit risk. Market risk
is the chance of financial loss resulting from changes in interest rates, foreign exchange rates and market
liquidity. Credit risk is the risk that a counterparty will not perform its obligations under a contract and it is
limited to the loss of the fair value gain in a derivative that the counterparty owes the Company. When the fair
value of a derivative contract is negative, the Company owes the counterparty and, therefore, has no credit risk
exposure to the counterparty; however, the counterparty has exposure to the Company. The Company
minimizes the credit risk in derivative instruments by entering into transactions with highly rated
F-57
SLM CORPORATION
NOTES TO CONSOLIDATED FINANCIAL STATEMENTS (Continued)
(Dollars in thousands, except per share amounts, unless otherwise stated)


