Sallie Mae 2008 Annual Report Download - page 182
Download and view the complete annual report
Please find page 182 of the 2008 Sallie Mae annual report below. You can navigate through the pages in the report by either clicking on the pages listed below, or by using the keyword search tool below to find specific information within the annual report.-
 1
1 -
2
-
3
-
4
-
5
-
6
-
7
-
8
-
9
-
10
-
11
-
12
-
13
-
14
-
15
-
16
-
17
-
18
-
19
-
20
-
21
-
22
-
23
-
24
-
25
-
26
-
27
-
28
-
29
-
30
-
31
-
32
-
33
-
34
-
35
-
36
-
37
-
38
-
39
-
40
-
41
-
42
-
43
-
44
-
45
-
46
-
47
-
48
-
49
-
50
-
51
-
52
-
53
-
54
-
55
-
56
-
57
-
58
-
59
-
60
-
61
-
62
-
63
-
64
-
65
-
66
-
67
-
68
-
69
-
70
-
71
-
72
-
73
-
74
-
75
-
76
-
77
-
78
-
79
-
80
-
81
-
82
-
83
-
84
-
85
-
86
-
87
-
88
-
89
-
90
-
91
-
92
-
93
-
94
-
95
-
96
-
97
-
98
-
99
-
100
-
101
-
102
-
103
-
104
-
105
-
106
-
107
-
108
-
109
-
110
-
111
-
112
-
113
-
114
-
115
-
116
-
117
-
118
-
119
-
120
-
121
-
122
-
123
-
124
-
125
-
126
-
127
-
128
-
129
-
130
-
131
-
132
-
133
-
134
-
135
-
136
-
137
-
138
-
139
-
140
-
141
-
142
-
143
-
144
-
145
-
146
-
147
-
148
-
149
-
150
-
151
-
152
-
153
-
154
-
155
-
156
-
157
-
158
-
159
-
160
-
161
-
162
-
163
-
164
-
165
-
166
-
167
-
168
-
169
-
170
-
171
-
 172
172 -
 173
173 -
 174
174 -
 175
175 -
 176
176 -
 177
177 -
 178
178 -
 179
179 -
 180
180 -
 181
181 -
 182
182 -
 183
183 -
 184
184 -
 185
185 -
 186
186 -
 187
187 -
 188
188 -
 189
189 -
 190
190 -
 191
191 -
 192
192 -
193
-
194
-
195
-
196
-
197
-
198
-
199
-
200
-
201
-
202
-
203
-
204
-
205
-
206
-
207
-
208
-
209
-
210
-
211
-
212
-
213
-
214
-
215
-
216
-
217
-
218
-
219
-
220
-
221
-
222
-
223
-
224
-
225
-
226
-
227
-
228
-
229
-
230
-
231
-
232
-
233
-
234
-
235
-
236
-
237
-
238
-
239
-
240
 |
 |

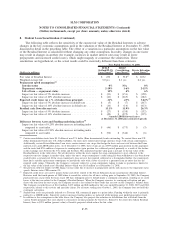
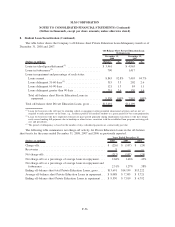
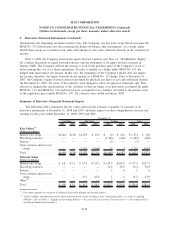
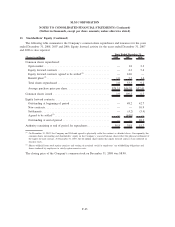
9. Derivative Financial Instruments (Continued)
(Dollars in millions) 2008 2007 2006 2008 2007 2006 2008 2007 2006 2008 2007 2006
Cash Flow Fair Value Trading Total
Years Ended December 31,
Change in fair value of cash flow
hedges . . . . . . . . . . . . . . . . . . $(71) $(16) $ (7) $ — $— $ — $ — $ — $ — $ (71) $ (16) $ (7)
Amortization of effective hedges
(1)
..—112———— ——— 112
Discontinued hedges . . . . . . . . . . . — — — — — — — — — — — —
Change in accumulated other
comprehensive income, net . . . . . $(71) $(15) $ 5 $ — $— $ — $ — $ — $ — $ (71) $ (15) $ 5
Earnings Summary
Amortization of closed futures
contracts’ gains/losses in interest
expense
(2)
. . . . . . . . . . . . . . . . $ — $ (2) $(19) $ — $— $ — $ — $ — $ — $ — $ (2) $ (19)
Gains (losses) on derivative and
hedging activities — Realized
(3)
. . — — — — — — 115 (18) (109) 115 (18) (109)
Gains (losses) on derivative and
hedging activities — Unrealized . . — — — 222
(4)
60
(4)
(13)
(4)
(782) (1,403) (243) (560) (1,343) (230)
Total earnings impact . . . . . . . . . . . $ — $ (2) $(19) $222 $60 $(13) $(667) $(1,421) $(352) $(445) $(1,363) $(358)
(1)
The Company expects to amortize $.1 million of after-tax net losses from accumulated other comprehensive income to earnings dur-
ing the next 12 months related to closed futures contracts that were hedging the forecasted issuance of debt instruments that are out-
standing as of December 31, 2008.
(2)
For futures contracts that qualify as SFAS No. 133 hedges where the hedged transaction occurs.
(3)
Includes net settlement income/expense related to trading derivatives and realized gains and losses related to derivative dispositions.
(4)
The change in fair value of cash flow and fair value hedges represents amounts related to ineffectiveness.
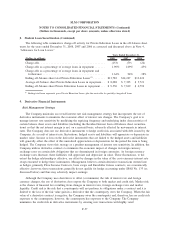
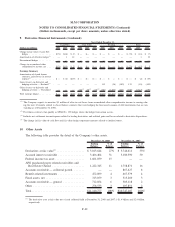
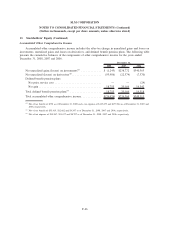
10. Other Assets
The following table provides the detail of the Company’s other assets.
Ending
Balance
%of
Balance
Ending
Balance
%of
Balance
December 31, 2008 December 31, 2007
Derivatives at fair value
(1)
.................. $ 3,013,644 27% $ 3,744,611 35%
Accrued interest receivable ................. 3,466,404 31 3,180,590 30
Federal income tax asset ................... 1,661,039 15 — —
APG purchased paper related receivables and
Real Estate Owned ..................... 1,222,345 11 1,758,871 16
Accounts receivable — collateral posted........ — — 867,427 8
Benefit-related investments ................. 472,899 4 467,379 4
Fixed assets, net ......................... 313,059 3 315,260 3
Accounts receivable — general .............. 712,854 6 305,118 2
Other ................................. 278,533 3 107,851 2
Total .................................. $11,140,777 100% $10,747,107 100%
(1)
The derivative asset at fair value net of cash collateral held at December 31, 2008 and 2007 is $1.4 billion and $2.4 billion,
respectively.
F-62
SLM CORPORATION
NOTES TO CONSOLIDATED FINANCIAL STATEMENTS (Continued)
(Dollars in thousands, except per share amounts, unless otherwise stated)