Sallie Mae 2008 Annual Report Download - page 102
Download and view the complete annual report
Please find page 102 of the 2008 Sallie Mae annual report below. You can navigate through the pages in the report by either clicking on the pages listed below, or by using the keyword search tool below to find specific information within the annual report.-
 1
1 -
2
-
3
-
4
-
5
-
6
-
7
-
8
-
9
-
10
-
11
-
12
-
13
-
14
-
15
-
16
-
17
-
18
-
19
-
20
-
21
-
22
-
23
-
24
-
25
-
26
-
27
-
28
-
29
-
30
-
31
-
32
-
33
-
34
-
35
-
36
-
37
-
38
-
39
-
40
-
41
-
42
-
43
-
44
-
45
-
46
-
47
-
48
-
49
-
50
-
51
-
52
-
53
-
54
-
55
-
56
-
57
-
58
-
59
-
60
-
61
-
62
-
63
-
64
-
65
-
66
-
67
-
68
-
69
-
70
-
71
-
72
-
73
-
74
-
75
-
76
-
77
-
78
-
79
-
80
-
81
-
82
-
83
-
84
-
85
-
86
-
87
-
88
-
89
-
90
-
91
-
 92
92 -
 93
93 -
 94
94 -
 95
95 -
 96
96 -
 97
97 -
 98
98 -
 99
99 -
 100
100 -
 101
101 -
 102
102 -
 103
103 -
 104
104 -
 105
105 -
 106
106 -
 107
107 -
 108
108 -
 109
109 -
 110
110 -
 111
111 -
 112
112 -
113
-
114
-
115
-
116
-
117
-
118
-
119
-
120
-
121
-
122
-
123
-
124
-
125
-
126
-
127
-
128
-
129
-
130
-
131
-
132
-
133
-
134
-
135
-
136
-
137
-
138
-
139
-
140
-
141
-
142
-
143
-
144
-
145
-
146
-
147
-
148
-
149
-
150
-
151
-
152
-
153
-
154
-
155
-
156
-
157
-
158
-
159
-
160
-
161
-
162
-
163
-
164
-
165
-
166
-
167
-
168
-
169
-
170
-
171
-
172
-
173
-
174
-
175
-
176
-
177
-
178
-
179
-
180
-
181
-
182
-
183
-
184
-
185
-
186
-
187
-
188
-
189
-
190
-
191
-
192
-
193
-
194
-
195
-
196
-
197
-
198
-
199
-
200
-
201
-
202
-
203
-
204
-
205
-
206
-
207
-
208
-
209
-
210
-
211
-
212
-
213
-
214
-
215
-
216
-
217
-
218
-
219
-
220
-
221
-
222
-
223
-
224
-
225
-
226
-
227
-
228
-
229
-
230
-
231
-
232
-
233
-
234
-
235
-
236
-
237
-
238
-
239
-
240
 |
 |

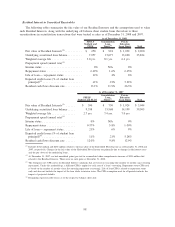
• Cost of funds assumptions related to the underlying auction rate securities bonds ($2.3 billion face
amount of bonds) within FFELP loan ($1.7 billion face amount of bonds) and Private Education Loan
($0.6 billion face amount of bonds) trusts were increased to take into account the expectations these
auction rate securities will continue to reset at higher rates for an extended period of time. This resulted
in a $116 million unrealized mark-to-market loss.
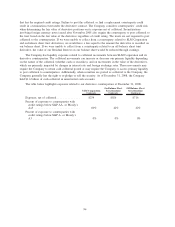
• The discount rate assumption related to the Private Education Loan and FFELP Residual Interests was
increased. The Company assessed the appropriateness of the current risk premium, which is added to
the risk free rate for the purpose of arriving at a discount rate, in light of the current economic and
credit uncertainty that exists in the market as of December 31, 2008. This discount rate is applied to
the projected cash flows to arrive at a fair value representative of the current economic conditions. The
Company increased the risk premium by 1,550 basis points and 390 basis points for Private Education
and FFELP, respectively, to take into account the current level of cash flow uncertainty and lack of
liquidity that exists with the Residual Interests. This resulted in a $904 million unrealized mark-to-mar-
ket loss.
The Company recorded net unrealized mark-to-market losses related to the Residual Interests of
$425 million during the year ended December 31, 2008. The mark-to-market losses were primarily related to
the increase in the discount rate assumptions discussed above which resulted in a $904 million mark-to-market
loss. This was partially offset by an unrealized mark-to-market gain of $555 million related to the Floor
Income component of the Residual Interest primarily due to the significant decrease in interest rates from
December 31, 2007 to December 31, 2008.
The Company recorded impairments to the Retained Interests of $254 million and $157 million,
respectively, for the years ended December 31, 2007 and 2006. The impairment charges were the result of
FFELP loans prepaying faster than projected through loan consolidations ($110 million and $104 million for
the years ended December 31, 2007 and 2006, respectively), impairment to the Floor Income component of
the Company’s Retained Interest due to increases in interest rates during the period ($24 million and
$53 million for the years ended December 31, 2007 and 2006, respectively), and increases in prepayments,
defaults, and the discount rate related to Private Education Loans ($120 million for the year ended
December 31, 2007). In addition, the Company recorded an unrealized mark-to-market loss under SFAS No. 155
of $25 million for the year ended December 31, 2007.
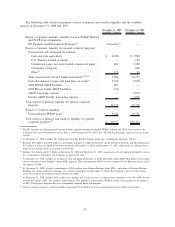
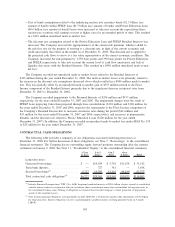
CONTRACTUAL CASH OBLIGATIONS
The following table provides a summary of our obligations associated with long-term notes at
December 31, 2008. For further discussion of these obligations, see Note 7, “Borrowings,” to the consolidated
financial statements. The Company has no outstanding equity forward positions outstanding after the contract
settlement on January 9, 2008. See Note 11, “Stockholders’ Equity,” to the consolidated financial statements.
1 Year
or Less
2to3
Years
4to5
Years
Over
5 Years Total
Long-term notes:
Unsecured borrowings ................. $ — $14,184 $ 5,324 $11,674 $ 31,182
Term bank deposits ................... — 727 381 — 1,108
Secured borrowings
(1)
................. 6,722 14,390 13,262 48,199 82,573
Total contractual cash obligations
(2)
....... $6,722 $29,301 $18,967 $59,873 $114,863
(1)
Includes Financial Interpretation (“FIN”) No. 46(R) long-term beneficial interests of $80.6 billion of notes issued by consolidated
variable interest entities in conjunction with our on-balance sheet securitization transactions and included in long-term notes in
the consolidated balance sheet. Timing of obligations is estimated based on the Company’s current projection of prepayment
speeds of the securitized assets.
(2)
Only includes principal obligations and specifically excludes SFAS No. 133 derivative market value adjustments of $3.4 billion
for long-term notes. Interest obligations on notes is predominantly variable in nature, resetting quarterly based on 3 month
LIBOR.
101