Sallie Mae 2008 Annual Report Download - page 25
Download and view the complete annual report
Please find page 25 of the 2008 Sallie Mae annual report below. You can navigate through the pages in the report by either clicking on the pages listed below, or by using the keyword search tool below to find specific information within the annual report.-
 1
1 -
2
-
3
-
4
-
5
-
6
-
7
-
8
-
9
-
10
-
11
-
12
-
13
-
14
-
 15
15 -
 16
16 -
 17
17 -
 18
18 -
 19
19 -
 20
20 -
 21
21 -
 22
22 -
 23
23 -
 24
24 -
 25
25 -
 26
26 -
 27
27 -
 28
28 -
 29
29 -
 30
30 -
 31
31 -
 32
32 -
 33
33 -
 34
34 -
 35
35 -
36
-
37
-
38
-
39
-
40
-
41
-
42
-
43
-
44
-
45
-
46
-
47
-
48
-
49
-
50
-
51
-
52
-
53
-
54
-
55
-
56
-
57
-
58
-
59
-
60
-
61
-
62
-
63
-
64
-
65
-
66
-
67
-
68
-
69
-
70
-
71
-
72
-
73
-
74
-
75
-
76
-
77
-
78
-
79
-
80
-
81
-
82
-
83
-
84
-
85
-
86
-
87
-
88
-
89
-
90
-
91
-
92
-
93
-
94
-
95
-
96
-
97
-
98
-
99
-
100
-
101
-
102
-
103
-
104
-
105
-
106
-
107
-
108
-
109
-
110
-
111
-
112
-
113
-
114
-
115
-
116
-
117
-
118
-
119
-
120
-
121
-
122
-
123
-
124
-
125
-
126
-
127
-
128
-
129
-
130
-
131
-
132
-
133
-
134
-
135
-
136
-
137
-
138
-
139
-
140
-
141
-
142
-
143
-
144
-
145
-
146
-
147
-
148
-
149
-
150
-
151
-
152
-
153
-
154
-
155
-
156
-
157
-
158
-
159
-
160
-
161
-
162
-
163
-
164
-
165
-
166
-
167
-
168
-
169
-
170
-
171
-
172
-
173
-
174
-
175
-
176
-
177
-
178
-
179
-
180
-
181
-
182
-
183
-
184
-
185
-
186
-
187
-
188
-
189
-
190
-
191
-
192
-
193
-
194
-
195
-
196
-
197
-
198
-
199
-
200
-
201
-
202
-
203
-
204
-
205
-
206
-
207
-
208
-
209
-
210
-
211
-
212
-
213
-
214
-
215
-
216
-
217
-
218
-
219
-
220
-
221
-
222
-
223
-
224
-
225
-
226
-
227
-
228
-
229
-
230
-
231
-
232
-
233
-
234
-
235
-
236
-
237
-
238
-
239
-
240
 |
 |
Item 7. Management’s Discussion and Analysis of Financial Condition and Results of Operations
MANAGEMENT’S DISCUSSION AND ANALYSIS OF
FINANCIAL CONDITION AND RESULTS OF OPERATIONS
Years ended December 31, 2006-2008
(Dollars in millions, except per share amounts, unless otherwise stated)
FORWARD-LOOKING AND CAUTIONARY STATEMENTS
Some of the statements contained in this Annual Report discuss future expectations and business
strategies or include other “forward-looking” information. Those statements are subject to known and unknown
risks, uncertainties and other factors that could cause the actual results to differ materially from those
contemplated by the statements. The forward-looking information is based on various factors and was derived
using numerous assumptions.
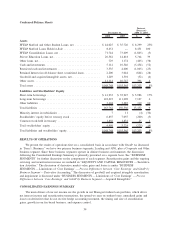
OVERVIEW
This section provides an overview of the Company’s 2008 business results from a financial perspective.
Certain financial impacts of funding and liquidity, loan losses, asset growth, fee income, the distressed debt
purchased paper business, operating expenses, and capital adequacy are summarized below. The income
statement amounts discussed in this Overview section are on a “Core Earnings” basis.
As discussed in the Business section, legislative changes to the FFELP, the credit markets and the
economic downturn impacted the Company’s financial results for 2008. The Company reported $526 million
in “Core Earnings” net income, a decrease from $560 million in 2007. (“Core Earnings” are defined in
“BUSINESS SEGMENTS — Limitations of ‘Core Earnings’ — Pre-tax Differences between ‘Core Earnings’
and GAAP by Business Segment.”)
Funding and Liquidity
The Company’s results were affected by higher funding costs than in prior periods. The higher costs
were, in part, related to the 2008 Asset-Backed Financing Facility; the after-tax fees for this Facility were
$225 million for the year. This Facility was reduced from $34 billion at the beginning of the year to $28 billion
by year end and was extended by 60 days to mature on April 28, 2009.
Our funding costs were also affected by higher than average interest rate index divergence. Most of our
FFELP loans earn interest based on market CP rates; our funding costs are primarily based on LIBOR. Due to
government intervention in the CP marketplace and other market dislocations, the spread widened as much as
200 basis points on certain days during the fourth quarter of 2008, compared to an average spread of 8 basis
points in the third quarter of 2008. ED established an alternative interest rate calculation for a portion of the
fourth quarter to address the issue, which resulted in a 21 basis point spread for the Company for the fourth
quarter.
In the fourth quarter, we secured access to stable and profitable funding sources for new FFELP and
Private Education Loan originations. ECASLA provides FFELP lenders with access to unlimited funding to
meet student demand through AY 2009-2010. Our Private Education Loan originations are being funded by
term deposits issued by Sallie Mae Bank.
The Company’s primary funding challenge is to replace our short-term funding sources, principally the
2008 Asset-Backed Financing Facility, with longer-term, lower-cost funding. Two federally-sponsored pro-
grams, the ED Conduit Program and the Federal Reserve Bank of New York’s Term Asset-Backed Liquidity
Facility, which are discussed in the “LIQUIDITY AND CAPITAL RESOURCES” section, are under develop-
ment and offer significant potential. At year end, approximately $30 billion in student loans assets were
eligible for these programs, which are expected to be operational in the first quarter of 2009.
In 2008, we issued approximately $26 billion in term funding, including $18.5 billion in term FFELP
ABS funding, which carried an average spread of 125 basis points over LIBOR. In early January 2009, we
24