Sallie Mae 2008 Annual Report Download - page 198
Download and view the complete annual report
Please find page 198 of the 2008 Sallie Mae annual report below. You can navigate through the pages in the report by either clicking on the pages listed below, or by using the keyword search tool below to find specific information within the annual report.-
 1
1 -
2
-
3
-
4
-
5
-
6
-
7
-
8
-
9
-
10
-
11
-
12
-
13
-
14
-
15
-
16
-
17
-
18
-
19
-
20
-
21
-
22
-
23
-
24
-
25
-
26
-
27
-
28
-
29
-
30
-
31
-
32
-
33
-
34
-
35
-
36
-
37
-
38
-
39
-
40
-
41
-
42
-
43
-
44
-
45
-
46
-
47
-
48
-
49
-
50
-
51
-
52
-
53
-
54
-
55
-
56
-
57
-
58
-
59
-
60
-
61
-
62
-
63
-
64
-
65
-
66
-
67
-
68
-
69
-
70
-
71
-
72
-
73
-
74
-
75
-
76
-
77
-
78
-
79
-
80
-
81
-
82
-
83
-
84
-
85
-
86
-
87
-
88
-
89
-
90
-
91
-
92
-
93
-
94
-
95
-
96
-
97
-
98
-
99
-
100
-
101
-
102
-
103
-
104
-
105
-
106
-
107
-
108
-
109
-
110
-
111
-
112
-
113
-
114
-
115
-
116
-
117
-
118
-
119
-
120
-
121
-
122
-
123
-
124
-
125
-
126
-
127
-
128
-
129
-
130
-
131
-
132
-
133
-
134
-
135
-
136
-
137
-
138
-
139
-
140
-
141
-
142
-
143
-
144
-
145
-
146
-
147
-
148
-
149
-
150
-
151
-
152
-
153
-
154
-
155
-
156
-
157
-
158
-
159
-
160
-
161
-
162
-
163
-
164
-
165
-
166
-
167
-
168
-
169
-
170
-
171
-
172
-
173
-
174
-
175
-
176
-
177
-
178
-
179
-
180
-
181
-
182
-
183
-
184
-
185
-
186
-
187
-
 188
188 -
 189
189 -
 190
190 -
 191
191 -
 192
192 -
 193
193 -
 194
194 -
 195
195 -
 196
196 -
 197
197 -
 198
198 -
 199
199 -
 200
200 -
 201
201 -
 202
202 -
 203
203 -
 204
204 -
 205
205 -
 206
206 -
 207
207 -
 208
208 -
209
-
210
-
211
-
212
-
213
-
214
-
215
-
216
-
217
-
218
-
219
-
220
-
221
-
222
-
223
-
224
-
225
-
226
-
227
-
228
-
229
-
230
-
231
-
232
-
233
-
234
-
235
-
236
-
237
-
238
-
239
-
240
 |
 |

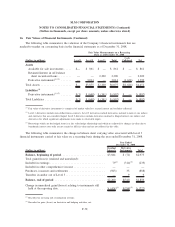
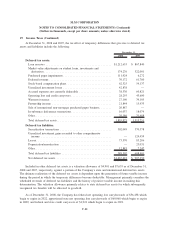
16. Fair Values of Financial Instruments (Continued)
The following table summarizes the valuation of the Company’s financial instruments that are
marked-to-market on a recurring basis in the financial statements as of December 31, 2008.
(Dollars in millions) Level 1 Level 2 Level 3 Total
Cash
Collateral Net
Fair Value Measurements on a Recurring
Basis as of December 31, 2008
Assets
Available for sale investments ..... $— $ 861 $ — $ 861 $ — $ 861
Retained Interest in off-balance
sheet securitized loans ......... — — 2,200 2,200 — 2,200
Derivative instruments
(1)(2)
....... — 3,014 — 3,014 (1,624) 1,390
Total Assets .................... $— $3,875 $2,200 $6,075 $(1,624) $4,451
Liabilities
(3)
Derivative instruments
(1)(2)
....... $(3) $ (648) $ (341) $ (992) $ — $ (992)
Total Liabilities ................. $(3) $ (648) $ (341) $ (992) $ — $ (992)
(1)
Fair value of derivative instruments is comprised of market value less accrued interest and excludes collateral.
(2)
Level 1 derivatives include euro-dollar futures contracts. Level 2 derivatives include derivatives indexed to interest rate indices
and currencies that are considered liquid. Level 3 derivatives include derivatives indexed to illiquid interest rate indices and
derivatives for which significant adjustments were made to observable inputs.
(3)
Borrowings which are the hedged items in a fair value hedge relationship and which are adjusted for changes in value due to
benchmark interest rates only are not carried at full fair value and are not reflected in this table.
The following table summarizes the change in balance sheet carrying value associated with Level 3
financial instruments carried at fair value on a recurring basis during the year ended December 31, 2008.
(Dollars in millions)
Residual
Interests
Derivative
Instruments Total
Year Ended
December 31, 2008
Balance, beginning of period............................ $3,044 $ (71) $2,973
Total gains/(losses) (realized and unrealized):
Included in earnings ................................... 79
(1)
(314)
(2)
(235)
Included in other comprehensive income .................... — — —
Purchases, issuances and settlements ....................... (923) 35 (888)
Transfers in and/or out of Level 3 ......................... — 9 9
Balance, end of period ................................ $2,200 $(341) $1,859
Change in unrealized gains/(losses) relating to instruments still
held at the reporting date.............................. $ (424)
(1)
$(298)
(2)
$ (722)
(1)
Recorded in servicing and securitization revenue.
(2)
Recorded in gains (losses) on derivative and hedging activities, net.
F-78
SLM CORPORATION
NOTES TO CONSOLIDATED FINANCIAL STATEMENTS (Continued)
(Dollars in thousands, except per share amounts, unless otherwise stated)