Sallie Mae 2008 Annual Report Download - page 5
Download and view the complete annual report
Please find page 5 of the 2008 Sallie Mae annual report below. You can navigate through the pages in the report by either clicking on the pages listed below, or by using the keyword search tool below to find specific information within the annual report.-
 1
1 -
 2
2 -
 3
3 -
 4
4 -
 5
5 -
 6
6 -
 7
7 -
 8
8 -
 9
9 -
 10
10 -
 11
11 -
 12
12 -
 13
13 -
 14
14 -
 15
15 -
 16
16 -
17
-
18
-
19
-
20
-
21
-
22
-
23
-
24
-
25
-
26
-
27
-
28
-
29
-
30
-
31
-
32
-
33
-
34
-
35
-
36
-
37
-
38
-
39
-
40
-
41
-
42
-
43
-
44
-
45
-
46
-
47
-
48
-
49
-
50
-
51
-
52
-
53
-
54
-
55
-
56
-
57
-
58
-
59
-
60
-
61
-
62
-
63
-
64
-
65
-
66
-
67
-
68
-
69
-
70
-
71
-
72
-
73
-
74
-
75
-
76
-
77
-
78
-
79
-
80
-
81
-
82
-
83
-
84
-
85
-
86
-
87
-
88
-
89
-
90
-
91
-
92
-
93
-
94
-
95
-
96
-
97
-
98
-
99
-
100
-
101
-
102
-
103
-
104
-
105
-
106
-
107
-
108
-
109
-
110
-
111
-
112
-
113
-
114
-
115
-
116
-
117
-
118
-
119
-
120
-
121
-
122
-
123
-
124
-
125
-
126
-
127
-
128
-
129
-
130
-
131
-
132
-
133
-
134
-
135
-
136
-
137
-
138
-
139
-
140
-
141
-
142
-
143
-
144
-
145
-
146
-
147
-
148
-
149
-
150
-
151
-
152
-
153
-
154
-
155
-
156
-
157
-
158
-
159
-
160
-
161
-
162
-
163
-
164
-
165
-
166
-
167
-
168
-
169
-
170
-
171
-
172
-
173
-
174
-
175
-
176
-
177
-
178
-
179
-
180
-
181
-
182
-
183
-
184
-
185
-
186
-
187
-
188
-
189
-
190
-
191
-
192
-
193
-
194
-
195
-
196
-
197
-
198
-
199
-
200
-
201
-
202
-
203
-
204
-
205
-
206
-
207
-
208
-
209
-
210
-
211
-
212
-
213
-
214
-
215
-
216
-
217
-
218
-
219
-
220
-
221
-
222
-
223
-
224
-
225
-
226
-
227
-
228
-
229
-
230
-
231
-
232
-
233
-
234
-
235
-
236
-
237
-
238
-
239
-
240
 |
 |
CP and LIBOR became distorted and volatile resulting in CP rates being substantially below LIBOR starting
in the fall of 2008.
To address this issue for the fourth quarter of 2008, ED announced that for purposes of calculating the
FFELP loan index from October 27, 2008 to the end of the fourth quarter, the Federal Reserve’s CP Funding
Facility rates would be used for those days in which no three-month financial CP rate was available. This
resulted in a CP/LIBOR spread of 21 basis points in the fourth quarter of 2008 compared to 8 basis points in
the third quarter of 2008. The CP/LIBOR spread would have been 62 basis points in the fourth quarter of
2008 if the ED had not addressed the issue by using the Federal Reserve’s CP Funding Facility rates discussed
above. The Company continues to work with Congress and ED to implement an acceptable long-term solution
to this issue.
On February 26, 2009, the Administration issued their 2010 budget request to Congress, which included
provisions that could impact significantly the FFELP. The President’s budget overview states: “FFEL
processors would continue to receive federal subsidies for new loans originated in the 2009-2010 academic
year and prior academic years under the regular FFEL program and the emergency programs established by
the Ensuring Continued Access to Student Loans Act of 2008.” The budget proposal must be passed in the
Congress, prior to enactment into law. The Company will work with Congress and ED to assist them in
achieving the objectives outlined in the Administration’s 2010 budget request.
In 2008, the Company conducted a thorough review of our entire business model and operations with a
goal of achieving appropriate risk adjusted returns across all of our business segments and providing cost-
effective services. As a result, we have reduced our operating expenses by over 20 percent in the fourth
quarter of 2008 compared to the fourth quarter of 2007, after adjusting for restructuring costs, growth and
other investments. This reduction was accomplished by lowering our headcount by a total of 2,900 or
26 percent, and consolidating operations through closing several work locations. The Company also curtailed
less profitable FFELP student loan acquisitions such as from Lender Partners, spot purchases and consolidation
lending. In our private education lending business, we curtailed high default lending programs, tightened credit
underwriting standards and increased pricing. We also made the decision to wind down our purchased
receivables business in our Asset Performance Group (“APG”) business segment to focus on our core student
loan collection business. These measures are discussed in more detail in the Business Segments discussion
below.
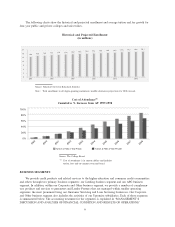
Student Lending Market
Students and their families use multiple sources of funding to pay for their college education including
savings, current income, grants, scholarships, and federally guaranteed and private education loans. Histori-
cally, one-third of the cost of an education has come from federally guaranteed student loans and private
education loans. Over the last five years, these sources of funding for higher education have been relatively
stable with a general trend towards an increased use of student loans. Due to the legislative changes described
above, a dramatic reduction in other sources of credit such as home equity and private education loans, and a
significant decline in personal wealth as a result of declining home prices and equity values, the Company
expects to see a substantial increase in borrowing from federal loan programs in the current and future years.
Federally Guaranteed Student Lending Programs
There are two loan delivery programs that provide federal government guaranteed student loans: the
FFELP and the Federal Direct Loan Program (“FDLP”). FFELP loans are provided by private sector
institutions and are ultimately guaranteed by ED, except for the Risk Sharing loss. FDLP loans are provided to
borrowers directly by ED on terms similar to student loans provided under the FFELP. We participate in and
are the largest lender under the FFELP program.
For the federal fiscal year (“FFY”) ended September 30, 2008 (FFY 2008), ED estimated that the market
share of FFELP loans was 76 percent, down from 80 percent in FFY 2007. (See “LENDING BUSINESS
SEGMENT — Competition.”) Total FFELP and FDLP volume for FFY 2008 grew by 17 percent, with the
FFELP portion growing 12 percent and the FDLP portion growing 40 percent.
4