Sallie Mae 2008 Annual Report Download - page 124
Download and view the complete annual report
Please find page 124 of the 2008 Sallie Mae annual report below. You can navigate through the pages in the report by either clicking on the pages listed below, or by using the keyword search tool below to find specific information within the annual report.-
 1
1 -
2
-
3
-
4
-
5
-
6
-
7
-
8
-
9
-
10
-
11
-
12
-
13
-
14
-
15
-
16
-
17
-
18
-
19
-
20
-
21
-
22
-
23
-
24
-
25
-
26
-
27
-
28
-
29
-
30
-
31
-
32
-
33
-
34
-
35
-
36
-
37
-
38
-
39
-
40
-
41
-
42
-
43
-
44
-
45
-
46
-
47
-
48
-
49
-
50
-
51
-
52
-
53
-
54
-
55
-
56
-
57
-
58
-
59
-
60
-
61
-
62
-
63
-
64
-
65
-
66
-
67
-
68
-
69
-
70
-
71
-
72
-
73
-
74
-
75
-
76
-
77
-
78
-
79
-
80
-
81
-
82
-
83
-
84
-
85
-
86
-
87
-
88
-
89
-
90
-
91
-
92
-
93
-
94
-
95
-
96
-
97
-
98
-
99
-
100
-
101
-
102
-
103
-
104
-
105
-
106
-
107
-
108
-
109
-
110
-
111
-
112
-
113
-
 114
114 -
 115
115 -
 116
116 -
 117
117 -
 118
118 -
 119
119 -
 120
120 -
 121
121 -
 122
122 -
 123
123 -
 124
124 -
 125
125 -
 126
126 -
 127
127 -
 128
128 -
 129
129 -
 130
130 -
 131
131 -
 132
132 -
 133
133 -
 134
134 -
135
-
136
-
137
-
138
-
139
-
140
-
141
-
142
-
143
-
144
-
145
-
146
-
147
-
148
-
149
-
150
-
151
-
152
-
153
-
154
-
155
-
156
-
157
-
158
-
159
-
160
-
161
-
162
-
163
-
164
-
165
-
166
-
167
-
168
-
169
-
170
-
171
-
172
-
173
-
174
-
175
-
176
-
177
-
178
-
179
-
180
-
181
-
182
-
183
-
184
-
185
-
186
-
187
-
188
-
189
-
190
-
191
-
192
-
193
-
194
-
195
-
196
-
197
-
198
-
199
-
200
-
201
-
202
-
203
-
204
-
205
-
206
-
207
-
208
-
209
-
210
-
211
-
212
-
213
-
214
-
215
-
216
-
217
-
218
-
219
-
220
-
221
-
222
-
223
-
224
-
225
-
226
-
227
-
228
-
229
-
230
-
231
-
232
-
233
-
234
-
235
-
236
-
237
-
238
-
239
-
240
 |
 |

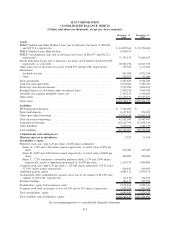
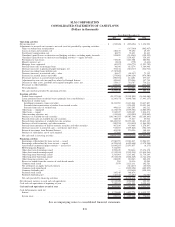
SLM CORPORATION
CONSOLIDATED BALANCE SHEETS
(Dollars and shares in thousands, except per share amounts)
December 31,
2008
December 31,
2007
Assets
FFELP Stafford and Other Student Loans (net of allowance for losses of $90,906
and $47,518, respectively) . ....................................... $ 44,025,361 $ 35,726,062
FFELP Stafford Loans Held-for-Sale . ................................. 8,450,976 —
FFELP Consolidation Loans (net of allowance for losses of $46,637 and $41,211,
respectively) . ................................................. 71,743,435 73,609,187
Private Education Loans (net of allowance for losses of $1,308,043 and $1,003,963,
respectively, as corrected). . ....................................... 20,582,298 14,817,725
Other loans (net of allowance for losses of $58,395 and $43,558, respectively) . . . . 729,380 1,173,666
Investments
Available-for-sale . . ............................................ 861,008 2,871,340
Other ....................................................... 180,397 93,040
Total investments ................................................ 1,041,405 2,964,380
Cash and cash equivalents . . . ....................................... 4,070,002 7,582,031
Restricted cash and investments ...................................... 3,535,286 4,600,106
Retained Interest in off-balance sheet securitized loans ..................... 2,200,298 3,044,038
Goodwill and acquired intangible assets, net . ............................ 1,249,219 1,300,689
Other assets . . . ................................................. 11,140,777 10,747,107
Total assets ..................................................... $168,768,437 $155,564,991
Liabilities
ED Participation Program . . . ....................................... $ 7,364,969 $ —
Term bank deposits . . . ............................................ 1,147,825 254,029
Other short-term borrowings . ....................................... 33,420,249 35,693,378
Total short-term borrowings . . ....................................... 41,933,043 35,947,407
Long-term borrowings . ............................................ 118,224,794 111,098,144
Other liabilities . ................................................. 3,604,260 3,284,545
Total liabilities . ................................................. 163,762,097 150,330,096
Commitments and contingencies
Minority interest in subsidiaries .................................... 7,270 11,360
Stockholders’ equity
Preferred stock, par value $.20 per share, 20,000 shares authorized
Series A: 3,300 and 3,300 shares issued, respectively, at stated value of $50 per
share ...................................................... 165,000 165,000
Series B: 4,000 and 4,000 shares issued, respectively, at stated value of $100 per
share ...................................................... 400,000 400,000
Series C, 7.25% mandatory convertible preferred stock; 1,150 and 1,000 shares,
respectively, issued at liquidation preference of $1,000 per share ........... 1,149,770 1,000,000
Common stock, par value $.20 per share, 1,125,000 shares authorized: 534,411 and
532,493 shares issued, respectively . ................................. 106,883 106,499
Additional paid-in capital . . . ....................................... 4,684,112 4,590,174
Accumulated other comprehensive income (loss) (net of tax benefit of $43,202 and
expense of $124,468, respectively) . ................................. (76,476) 236,364
Retained earnings ................................................ 426,175 557,204
Stockholders’ equity before treasury stock . . ............................ 6,855,464 7,055,241
Common stock held in treasury at cost: 66,958 and 65,951 shares, respectively . . . . 1,856,394 1,831,706
Total stockholders’ equity . . . ....................................... 4,999,070 5,223,535
Total liabilities and stockholders’ equity ................................ $168,768,437 $155,564,991
See accompanying notes to consolidated financial statements.
F-4