Sallie Mae 2008 Annual Report Download - page 74
Download and view the complete annual report
Please find page 74 of the 2008 Sallie Mae annual report below. You can navigate through the pages in the report by either clicking on the pages listed below, or by using the keyword search tool below to find specific information within the annual report.-
 1
1 -
2
-
3
-
4
-
5
-
6
-
7
-
8
-
9
-
10
-
11
-
12
-
13
-
14
-
15
-
16
-
17
-
18
-
19
-
20
-
21
-
22
-
23
-
24
-
25
-
26
-
27
-
28
-
29
-
30
-
31
-
32
-
33
-
34
-
35
-
36
-
37
-
38
-
39
-
40
-
41
-
42
-
43
-
44
-
45
-
46
-
47
-
48
-
49
-
50
-
51
-
52
-
53
-
54
-
55
-
56
-
57
-
58
-
59
-
60
-
61
-
62
-
63
-
 64
64 -
 65
65 -
 66
66 -
 67
67 -
 68
68 -
 69
69 -
 70
70 -
 71
71 -
 72
72 -
 73
73 -
 74
74 -
 75
75 -
 76
76 -
 77
77 -
 78
78 -
 79
79 -
 80
80 -
 81
81 -
 82
82 -
 83
83 -
 84
84 -
85
-
86
-
87
-
88
-
89
-
90
-
91
-
92
-
93
-
94
-
95
-
96
-
97
-
98
-
99
-
100
-
101
-
102
-
103
-
104
-
105
-
106
-
107
-
108
-
109
-
110
-
111
-
112
-
113
-
114
-
115
-
116
-
117
-
118
-
119
-
120
-
121
-
122
-
123
-
124
-
125
-
126
-
127
-
128
-
129
-
130
-
131
-
132
-
133
-
134
-
135
-
136
-
137
-
138
-
139
-
140
-
141
-
142
-
143
-
144
-
145
-
146
-
147
-
148
-
149
-
150
-
151
-
152
-
153
-
154
-
155
-
156
-
157
-
158
-
159
-
160
-
161
-
162
-
163
-
164
-
165
-
166
-
167
-
168
-
169
-
170
-
171
-
172
-
173
-
174
-
175
-
176
-
177
-
178
-
179
-
180
-
181
-
182
-
183
-
184
-
185
-
186
-
187
-
188
-
189
-
190
-
191
-
192
-
193
-
194
-
195
-
196
-
197
-
198
-
199
-
200
-
201
-
202
-
203
-
204
-
205
-
206
-
207
-
208
-
209
-
210
-
211
-
212
-
213
-
214
-
215
-
216
-
217
-
218
-
219
-
220
-
221
-
222
-
223
-
224
-
225
-
226
-
227
-
228
-
229
-
230
-
231
-
232
-
233
-
234
-
235
-
236
-
237
-
238
-
239
-
240
 |
 |

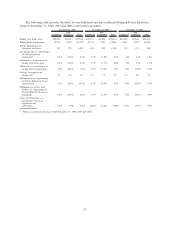
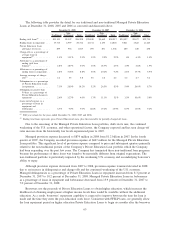
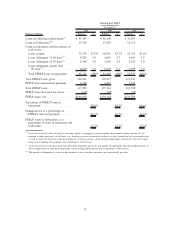
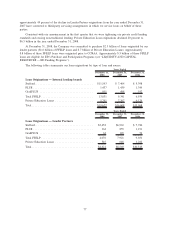
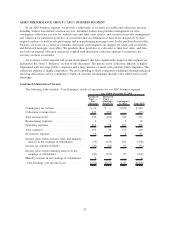
Total Managed Basis loan provisions
2008 2007 2006
Years Ended
December 31,
Private Education Loans. . . .................................. $ 874 $1,233 $273
FFELP Loans ............................................ 127 121 17
Mortgage and consumer loans ................................ 28 40 13
Total Managed Basis provisions for loan losses.................... $1,029 $1,394 $303
Provision expense for Private Education Loans was previously discussed above (see “Activity in the
Allowance for Private Education Loan Losses”).
The 2008 provision for FFELP loans is up slightly over the prior year, but up significantly from 2006.
The increase in provision over 2006 related primarily to legislative changes (the change to a lower rate of
insurance on loans disbursed after June 30, 2006 and the repeal of the Exceptional Performer program in
2007) which increased our Risk Sharing percentage on the portfolio. Additionally, growth in the repayment
portion of the portfolio and a rise in delinquencies and charge-offs led to an increase in future default
expectations.
The increase in provision related to mortgage and consumer loans for the years ended December 31, 2008
and 2007 compared to the year ended December 31, 2006, primarily related to a weakening U.S. economy and
the deterioration of certain real estate markets related to our mortgage portfolio. As of December 31, 2008,
our mortgage portfolio totaled $242 million.
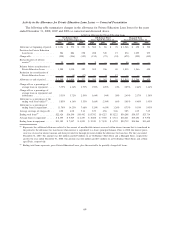
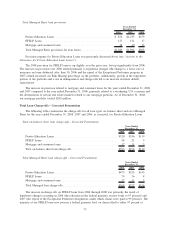
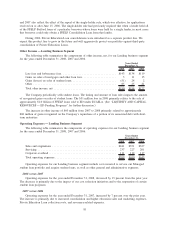
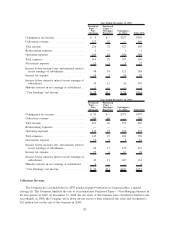
Total Loan Charge-offs – Corrected Presentation
The following tables summarize the charge-offs for all loan types on-balance sheet and on a Managed
Basis for the years ended December 31, 2008, 2007 and 2006, as corrected, for Private Education Loans.
Total on-balance sheet loan charge-offs – Corrected Presentation
2008 2007 2006
Years Ended
December 31,
Private Education Loans ....................................... $320 $246 $119
FFELP Loans ............................................... 58 21 5
Mortgage and consumer loans ................................... 17 11 5
Total on-balance sheet loan charge-offs ............................ $395 $278 $129
Total Managed Basis loan charge-offs – Corrected Presentation
2008 2007 2006
Years Ended
December 31,
Private Education Loans ....................................... $473 $325 $143
FFELP Loans ............................................... 79 36 8
Mortgage and consumer loans ................................... 17 11 5
Total Managed loan charge-offs .................................. $569 $372 $156
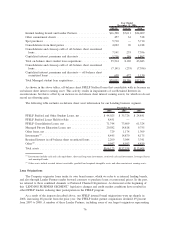
The increase in charge-offs on FFELP loans from 2006 through 2008 was primarily the result of
legislative changes occurring in 2006 (the reduction in the federal guaranty on new loans to 97 percent) and
2007 (the repeal of the Exceptional Performer designation, under which claims were paid at 99 percent). The
majority of our FFELP loans now possess a federal guaranty level on claims filed to either 97 percent or
73