Sallie Mae 2008 Annual Report Download - page 191
Download and view the complete annual report
Please find page 191 of the 2008 Sallie Mae annual report below. You can navigate through the pages in the report by either clicking on the pages listed below, or by using the keyword search tool below to find specific information within the annual report.-
 1
1 -
2
-
3
-
4
-
5
-
6
-
7
-
8
-
9
-
10
-
11
-
12
-
13
-
14
-
15
-
16
-
17
-
18
-
19
-
20
-
21
-
22
-
23
-
24
-
25
-
26
-
27
-
28
-
29
-
30
-
31
-
32
-
33
-
34
-
35
-
36
-
37
-
38
-
39
-
40
-
41
-
42
-
43
-
44
-
45
-
46
-
47
-
48
-
49
-
50
-
51
-
52
-
53
-
54
-
55
-
56
-
57
-
58
-
59
-
60
-
61
-
62
-
63
-
64
-
65
-
66
-
67
-
68
-
69
-
70
-
71
-
72
-
73
-
74
-
75
-
76
-
77
-
78
-
79
-
80
-
81
-
82
-
83
-
84
-
85
-
86
-
87
-
88
-
89
-
90
-
91
-
92
-
93
-
94
-
95
-
96
-
97
-
98
-
99
-
100
-
101
-
102
-
103
-
104
-
105
-
106
-
107
-
108
-
109
-
110
-
111
-
112
-
113
-
114
-
115
-
116
-
117
-
118
-
119
-
120
-
121
-
122
-
123
-
124
-
125
-
126
-
127
-
128
-
129
-
130
-
131
-
132
-
133
-
134
-
135
-
136
-
137
-
138
-
139
-
140
-
141
-
142
-
143
-
144
-
145
-
146
-
147
-
148
-
149
-
150
-
151
-
152
-
153
-
154
-
155
-
156
-
157
-
158
-
159
-
160
-
161
-
162
-
163
-
164
-
165
-
166
-
167
-
168
-
169
-
170
-
171
-
172
-
173
-
174
-
175
-
176
-
177
-
178
-
179
-
180
-
 181
181 -
 182
182 -
 183
183 -
 184
184 -
 185
185 -
 186
186 -
 187
187 -
 188
188 -
 189
189 -
 190
190 -
 191
191 -
 192
192 -
 193
193 -
 194
194 -
 195
195 -
 196
196 -
 197
197 -
 198
198 -
 199
199 -
 200
200 -
 201
201 -
202
-
203
-
204
-
205
-
206
-
207
-
208
-
209
-
210
-
211
-
212
-
213
-
214
-
215
-
216
-
217
-
218
-
219
-
220
-
221
-
222
-
223
-
224
-
225
-
226
-
227
-
228
-
229
-
230
-
231
-
232
-
233
-
234
-
235
-
236
-
237
-
238
-
239
-
240
 |
 |

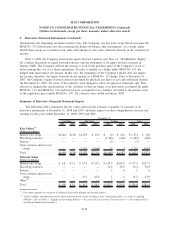
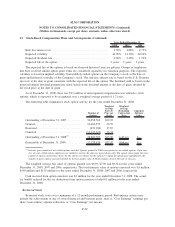
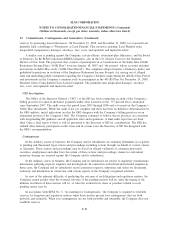
13. Stock-Based Compensation Plans and Arrangements (Continued)
The total fair value of RSUs that vested during the years ended December 31, 2007 and 2006 was
$26 million and $15 million, respectively. No RSUs vested in 2008. The total intrinsic value of RSUs
converted to common stock during the years ended December 31, 2008 and 2006 was $26 million and
$10 million, respectively. There were no RSUs converted to common stock for the year ended December 31,
2007.
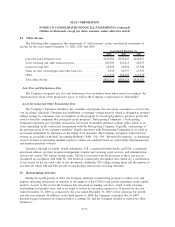
Employee Stock Purchase Plan
Under the ESPP, employees can purchase shares of the Company’s common stock at the end of a
12-month offering period at a price equal to the share price at the beginning of the 12-month period, less
15 percent, up to a maximum purchase price of $7,500 plus accrued interest. The purchase price for each
offering is determined at the beginning of the offering period.
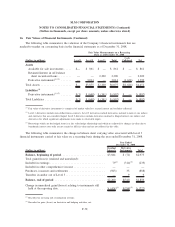
The fair values of the stock purchase rights of the ESPP offerings in the years ended December 31, 2008,
2007 and 2006 were calculated using a Black-Scholes option pricing model with the following weighted
average assumptions.
2008 2007 2006
Years Ended December 31,
Risk-free interest rate ..................................... 1.91% 4.97% 4.75%
Expected volatility ....................................... 57.59% 22.67% 20.41%
Expected dividend rate .................................... 0.00% 2.19% 1.92%
Expected life of the option . . ............................... 1year 2 years 2 years
The expected volatility is based on implied volatility from publicly-traded options on the Company’s
stock at the date of grant and historical volatility of the Company’s stock. The risk-free interest rate is based
on the U.S. Treasury spot rate at the date of grant consistent with the expected life. The dividend yield is
based on the projected annual dividend payment per share based on the current dividend amount at the date of
grant, divided by the stock price at the date of grant.
The weighted average fair value of the stock purchase rights of the ESPP offerings for the years ended
December 31, 2008, 2007 and 2006 was $6.57, $10.41 and $11.31, respectively. The fair value for 2008 was
amortized to compensation cost on a straight-line basis over a one-year vesting period. The fair values for
2007 and 2006 were amortized to compensation cost on a straight-line basis over a two-year vesting period.
As of December 31, 2008, there was $.1 million of unrecognized compensation cost related to the ESPP,
which is expected to be recognized in January 2009.
During the years ended December 31, 2007 and 2006, plan participants purchased 215,058 shares and
182,066 shares, respectively, of the Company’s common stock. No shares were purchased in 2008.
F-71
SLM CORPORATION
NOTES TO CONSOLIDATED FINANCIAL STATEMENTS (Continued)
(Dollars in thousands, except per share amounts, unless otherwise stated)