Sallie Mae 2008 Annual Report Download - page 37
Download and view the complete annual report
Please find page 37 of the 2008 Sallie Mae annual report below. You can navigate through the pages in the report by either clicking on the pages listed below, or by using the keyword search tool below to find specific information within the annual report.-
 1
1 -
2
-
3
-
4
-
5
-
6
-
7
-
8
-
9
-
10
-
11
-
12
-
13
-
14
-
15
-
16
-
17
-
18
-
19
-
20
-
21
-
22
-
23
-
24
-
25
-
26
-
 27
27 -
 28
28 -
 29
29 -
 30
30 -
 31
31 -
 32
32 -
 33
33 -
 34
34 -
 35
35 -
 36
36 -
 37
37 -
 38
38 -
 39
39 -
 40
40 -
 41
41 -
 42
42 -
 43
43 -
 44
44 -
 45
45 -
 46
46 -
 47
47 -
48
-
49
-
50
-
51
-
52
-
53
-
54
-
55
-
56
-
57
-
58
-
59
-
60
-
61
-
62
-
63
-
64
-
65
-
66
-
67
-
68
-
69
-
70
-
71
-
72
-
73
-
74
-
75
-
76
-
77
-
78
-
79
-
80
-
81
-
82
-
83
-
84
-
85
-
86
-
87
-
88
-
89
-
90
-
91
-
92
-
93
-
94
-
95
-
96
-
97
-
98
-
99
-
100
-
101
-
102
-
103
-
104
-
105
-
106
-
107
-
108
-
109
-
110
-
111
-
112
-
113
-
114
-
115
-
116
-
117
-
118
-
119
-
120
-
121
-
122
-
123
-
124
-
125
-
126
-
127
-
128
-
129
-
130
-
131
-
132
-
133
-
134
-
135
-
136
-
137
-
138
-
139
-
140
-
141
-
142
-
143
-
144
-
145
-
146
-
147
-
148
-
149
-
150
-
151
-
152
-
153
-
154
-
155
-
156
-
157
-
158
-
159
-
160
-
161
-
162
-
163
-
164
-
165
-
166
-
167
-
168
-
169
-
170
-
171
-
172
-
173
-
174
-
175
-
176
-
177
-
178
-
179
-
180
-
181
-
182
-
183
-
184
-
185
-
186
-
187
-
188
-
189
-
190
-
191
-
192
-
193
-
194
-
195
-
196
-
197
-
198
-
199
-
200
-
201
-
202
-
203
-
204
-
205
-
206
-
207
-
208
-
209
-
210
-
211
-
212
-
213
-
214
-
215
-
216
-
217
-
218
-
219
-
220
-
221
-
222
-
223
-
224
-
225
-
226
-
227
-
228
-
229
-
230
-
231
-
232
-
233
-
234
-
235
-
236
-
237
-
238
-
239
-
240
 |
 |
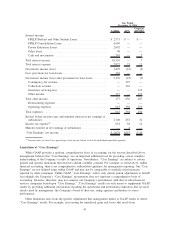
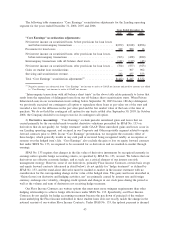
Losses on loans and securities, net, totaled $186 million for the year ended December 31, 2008, a
$91 million increase from $95 million incurred in the year ended December 31, 2007. Prior to the fourth
quarter of 2008, these losses were primarily the result of our repurchase of delinquent Private Education Loans
from our off-balance sheet securitization trusts. When Private Education Loans in our off-balance sheet
securitization trusts that settled before September 30, 2005 became 180 days delinquent, we previously
exercised our contingent call option to repurchase these loans at par value out of the trusts and recorded a loss
for the difference in the par value paid and the fair market value of the loans at the time of purchase. We do
not hold the contingent call option for any trusts that settled after September 30, 2005. Beginning in October
2008, we decided to no longer exercise our contingent call option. The loss in the fourth quarter of 2008
primarily relates to the sale of approximately $1.0 billion FFELP loans to ED under the ECASLA, which
resulted in a $53 million loss. See “LIQUIDITY AND CAPITAL RESOURCES — ED Funding Programs” for
further discussion.
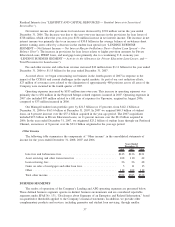
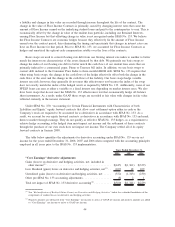
We are restructuring our business in response to the impact of CCRAA and current challenges in the
capital markets. In conjunction with our restructuring plan, we are refocusing our lending activities, exiting
certain customer relationships and product lines, and winding down our debt purchase paper businesses. As a
result, during 2008 we have reduced our operating expenses by over 20 percent in the fourth quarter of 2008
compared to the fourth quarter of 2007, after adjusting for restructuring costs, growth and other investments.
As part of our cost reduction efforts, restructuring expenses of $84 million and $23 million were recognized in
the years ended December 31, 2008 and 2007, respectively. Restructuring expenses from the fourth quarter of
2007 through the fourth quarter of 2008 totaled $106 million. The majority of these restructuring expenses
were severance costs related to the completed and planned elimination of approximately 2,900 positions, or
approximately 26 percent of the workforce. We estimate approximately $8 million to $15 million of additional
restructuring expenses associated with our current cost reduction efforts will be incurred and our current
restructuring plan will be substantially complete by the end of 2009. During 2009, we will continue to review
our business to determine whether there are other opportunities to further streamline the business.
Operating expenses totaled $1.4 billion and $1.5 billion for the years ended December 31, 2008 and
2007, respectively. The year-over-year reduction is primarily due to our cost reduction efforts discussed above.
Of these amounts, $91 million and $112 million, respectively, relate to amortization and impairment of
goodwill and intangible assets.
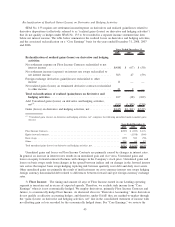
Year Ended December 31, 2007 Compared to Year Ended December 31, 2006
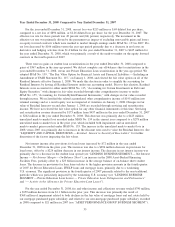
For the year ended December 31, 2007, our net loss was $896 million, or $2.26 diluted loss per share,
compared to net income of $1.2 billion, or $2.63 diluted earnings per share, in the year-ago period. The
effective tax rate in those periods was (86) percent and 42 percent, respectively. The movement in the effective
tax rate was primarily driven by the permanent tax impact of excluding non-taxable gains and losses on equity
forward contracts which are marked to market through earnings under the FASB’s SFAS No. 133. Pre-tax
income decreased by $2.5 billion versus the year ended December 31, 2006 primarily due to a $1.0 billion
increase in net losses on derivative and hedging activities, which was mostly comprised of losses on our equity
forward contracts. Losses on derivative and hedging activities were $1.4 billion for the year ended
December 31, 2007 compared to $339 million for the year ended December 31, 2006.
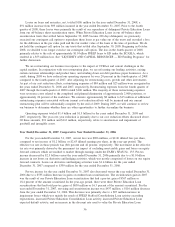
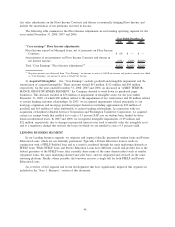
Pre-tax income for the year ended December 31, 2007 also decreased versus the year ended December 31,
2006 due to a $535 million decrease in gains on student loan securitizations. The securitization gain in 2007
was the result of one Private Education Loan securitization that had a pre-tax gain of $367 million or
18.4 percent of the amount securitized. In the year-ago period, there were three Private Education Loan
securitizations that had total pre-tax gains of $830 million or 16.3 percent of the amount securitized. For the
year ended December 31, 2007, servicing and securitization income was $437 million, a $116 million decrease
from the year ended December 31, 2006. This decrease was primarily due to a $97 million increase in
impairment losses which was mainly the result of FFELP Stafford Consolidation Loan activity exceeding
expectations, increased Private Education Consolidation Loan activity, increased Private Education Loan
expected default activity, and an increase in the discount rate used to value the Private Education Loan
36