Sallie Mae 2008 Annual Report Download - page 125
Download and view the complete annual report
Please find page 125 of the 2008 Sallie Mae annual report below. You can navigate through the pages in the report by either clicking on the pages listed below, or by using the keyword search tool below to find specific information within the annual report.-
 1
1 -
2
-
3
-
4
-
5
-
6
-
7
-
8
-
9
-
10
-
11
-
12
-
13
-
14
-
15
-
16
-
17
-
18
-
19
-
20
-
21
-
22
-
23
-
24
-
25
-
26
-
27
-
28
-
29
-
30
-
31
-
32
-
33
-
34
-
35
-
36
-
37
-
38
-
39
-
40
-
41
-
42
-
43
-
44
-
45
-
46
-
47
-
48
-
49
-
50
-
51
-
52
-
53
-
54
-
55
-
56
-
57
-
58
-
59
-
60
-
61
-
62
-
63
-
64
-
65
-
66
-
67
-
68
-
69
-
70
-
71
-
72
-
73
-
74
-
75
-
76
-
77
-
78
-
79
-
80
-
81
-
82
-
83
-
84
-
85
-
86
-
87
-
88
-
89
-
90
-
91
-
92
-
93
-
94
-
95
-
96
-
97
-
98
-
99
-
100
-
101
-
102
-
103
-
104
-
105
-
106
-
107
-
108
-
109
-
110
-
111
-
112
-
113
-
114
-
 115
115 -
 116
116 -
 117
117 -
 118
118 -
 119
119 -
 120
120 -
 121
121 -
 122
122 -
 123
123 -
 124
124 -
 125
125 -
 126
126 -
 127
127 -
 128
128 -
 129
129 -
 130
130 -
 131
131 -
 132
132 -
 133
133 -
 134
134 -
 135
135 -
136
-
137
-
138
-
139
-
140
-
141
-
142
-
143
-
144
-
145
-
146
-
147
-
148
-
149
-
150
-
151
-
152
-
153
-
154
-
155
-
156
-
157
-
158
-
159
-
160
-
161
-
162
-
163
-
164
-
165
-
166
-
167
-
168
-
169
-
170
-
171
-
172
-
173
-
174
-
175
-
176
-
177
-
178
-
179
-
180
-
181
-
182
-
183
-
184
-
185
-
186
-
187
-
188
-
189
-
190
-
191
-
192
-
193
-
194
-
195
-
196
-
197
-
198
-
199
-
200
-
201
-
202
-
203
-
204
-
205
-
206
-
207
-
208
-
209
-
210
-
211
-
212
-
213
-
214
-
215
-
216
-
217
-
218
-
219
-
220
-
221
-
222
-
223
-
224
-
225
-
226
-
227
-
228
-
229
-
230
-
231
-
232
-
233
-
234
-
235
-
236
-
237
-
238
-
239
-
240
 |
 |

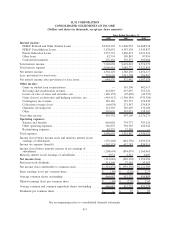
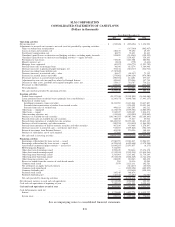
SLM CORPORATION
CONSOLIDATED STATEMENTS OF INCOME
(Dollars and shares in thousands, except per share amounts)
2008 2007 2006
Years Ended December 31,
Interest income:
FFELP Stafford and Other Student Loans .................. $1,994,394 $ 2,060,993 $1,408,938
FFELP Consolidation Loans............................ 3,178,692 4,343,138 3,545,857
Private Education Loans............................... 1,737,554 1,456,471 1,021,221
Other loans ........................................ 82,734 105,843 97,954
Cash and investments................................. 276,264 707,577 503,002
Total interest income ................................... 7,269,638 8,674,022 6,576,972
Total interest expense .................................. 5,905,418 7,085,772 5,122,855
Net interest income .................................... 1,364,220 1,588,250 1,454,117
Less: provisions for loan losses ........................... 719,650 1,015,308 286,962
Net interest income after provisions for loan losses ............ 644,570 572,942 1,167,155
Other income:
Gains on student loan securitizations ..................... — 367,300 902,417
Servicing and securitization revenue ...................... 261,819 437,097 553,541
Losses on sales of loans and securities, net . . . .............. (186,155) (95,492) (49,357)
Gains (losses) on derivative and hedging activities, net ........ (445,413) (1,360,584) (339,396)
Contingency fee revenue .............................. 340,140 335,737 396,830
Collections revenue (loss) ............................. (64,038) 271,547 239,829
Guarantor servicing fees .............................. 121,363 156,429 132,100
Other ............................................ 392,076 385,075 338,307
Total other income .................................... 419,792 497,109 2,174,271
Operating expenses:
Salaries and benefits ................................. 610,020 734,777 703,210
Other operating expenses .............................. 746,835 794,565 642,942
Restructuring expenses................................ 83,775 22,505 —
Total expenses........................................ 1,440,630 1,551,847 1,346,152
Income (loss) before income taxes and minority interest in net
earnings of subsidiaries ............................... (376,268) (481,796) 1,995,274
Income tax expense (benefit) ............................. (167,574) 412,283 834,311
Income (loss) before minority interest in net earnings of
subsidiaries ........................................ (208,694) (894,079) 1,160,963
Minority interest in net earnings of subsidiaries . .............. 3,932 2,315 4,007
Net income (loss) ..................................... (212,626) (896,394) 1,156,956
Preferred stock dividends................................ 111,206 37,145 35,567
Net income (loss) attributable to common stock . .............. $ (323,832) $ (933,539) $1,121,389
Basic earnings (loss) per common share ..................... $ (.69) $ (2.26) $ 2.73
Average common shares outstanding ....................... 466,642 412,233 410,805
Diluted earnings (loss) per common share ................... $ (.69) $ (2.26) $ 2.63
Average common and common equivalent shares outstanding ..... 466,642 412,233 451,170
Dividends per common share ............................. $ — $ .25 $ .97
See accompanying notes to consolidated financial statements.
F-5