Sallie Mae 2008 Annual Report Download - page 85
Download and view the complete annual report
Please find page 85 of the 2008 Sallie Mae annual report below. You can navigate through the pages in the report by either clicking on the pages listed below, or by using the keyword search tool below to find specific information within the annual report.-
 1
1 -
2
-
3
-
4
-
5
-
6
-
7
-
8
-
9
-
10
-
11
-
12
-
13
-
14
-
15
-
16
-
17
-
18
-
19
-
20
-
21
-
22
-
23
-
24
-
25
-
26
-
27
-
28
-
29
-
30
-
31
-
32
-
33
-
34
-
35
-
36
-
37
-
38
-
39
-
40
-
41
-
42
-
43
-
44
-
45
-
46
-
47
-
48
-
49
-
50
-
51
-
52
-
53
-
54
-
55
-
56
-
57
-
58
-
59
-
60
-
61
-
62
-
63
-
64
-
65
-
66
-
67
-
68
-
69
-
70
-
71
-
72
-
73
-
74
-
 75
75 -
 76
76 -
 77
77 -
 78
78 -
 79
79 -
 80
80 -
 81
81 -
 82
82 -
 83
83 -
 84
84 -
 85
85 -
 86
86 -
 87
87 -
 88
88 -
 89
89 -
 90
90 -
 91
91 -
 92
92 -
 93
93 -
 94
94 -
 95
95 -
96
-
97
-
98
-
99
-
100
-
101
-
102
-
103
-
104
-
105
-
106
-
107
-
108
-
109
-
110
-
111
-
112
-
113
-
114
-
115
-
116
-
117
-
118
-
119
-
120
-
121
-
122
-
123
-
124
-
125
-
126
-
127
-
128
-
129
-
130
-
131
-
132
-
133
-
134
-
135
-
136
-
137
-
138
-
139
-
140
-
141
-
142
-
143
-
144
-
145
-
146
-
147
-
148
-
149
-
150
-
151
-
152
-
153
-
154
-
155
-
156
-
157
-
158
-
159
-
160
-
161
-
162
-
163
-
164
-
165
-
166
-
167
-
168
-
169
-
170
-
171
-
172
-
173
-
174
-
175
-
176
-
177
-
178
-
179
-
180
-
181
-
182
-
183
-
184
-
185
-
186
-
187
-
188
-
189
-
190
-
191
-
192
-
193
-
194
-
195
-
196
-
197
-
198
-
199
-
200
-
201
-
202
-
203
-
204
-
205
-
206
-
207
-
208
-
209
-
210
-
211
-
212
-
213
-
214
-
215
-
216
-
217
-
218
-
219
-
220
-
221
-
222
-
223
-
224
-
225
-
226
-
227
-
228
-
229
-
230
-
231
-
232
-
233
-
234
-
235
-
236
-
237
-
238
-
239
-
240
 |
 |

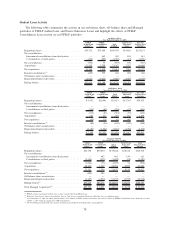
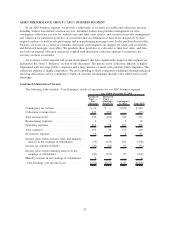
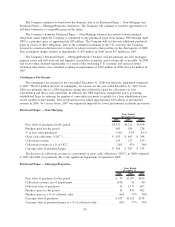
The Company continues to wind down the domestic side of its Purchased Paper — Non-Mortgage and
Purchased Paper — Mortgage/Properties businesses. The Company will continue to consider opportunities to
sell these businesses at acceptable prices in the future.
The Company’s domestic Purchased Paper — Non-Mortgage business has certain forward purchase
obligations under which the Company is committed to buy purchased paper from January 2009 through April
2009 at a purchase price of approximately $28 million. The Company will not buy any additional purchased
paper in excess of these obligations. Due to the continued weakening of the U.S. economy, the Company
lowered its assumed collection rates it expects to achieve related to this portfolio in the third quarter of 2008.
This assumption change resulted in impairments of $55 million in 2008 versus $17 million in 2007.
The Company’s Purchased Paper — Mortgage/Properties business will not purchase any new mortgage/
property assets and will work-out and liquidate its portfolio as quickly and economically as possible. In 2008,
real estate values declined significantly as a result of the weakening U.S. economy and expected future
resolution time-frames were extended, resulting in impairments of $262 million in 2008 versus $4 million in
2007.
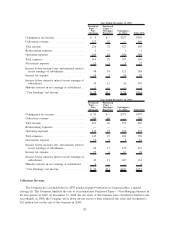
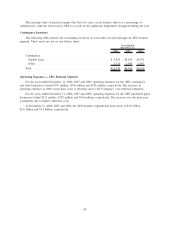
Contingency Fee Income
The contingency fee income for the year ended December 31, 2008 was relatively unchanged compared
to 2007. The $61 million decrease in contingency fee income for the year ended December 31, 2007 versus
2006 was primarily due to a 2006 legislative change that reduced fees paid for collections via loan
consolidation and direct cash collections. In addition, the 2006 legislation changed the policy governing
rehabilitated loans by reducing the number of consecutive payments to qualify for a loan rehabilitation from
twelve months to nine months. This accelerated process added approximately $36 million of incremental
revenue in 2006. To a lesser extent, 2007 was negatively impacted by lower performance in default prevention.
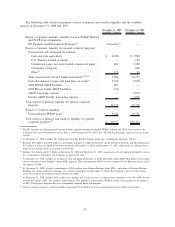
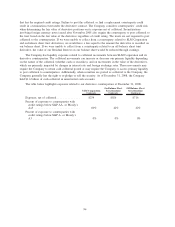
Purchased Paper — Non-Mortgage
2008 2007 2006
Years Ended
December 31,
Face value of purchases for the period ......................... $5,353 $6,111 $3,438
Purchase price for the period ................................ 483 556 278
% of face value purchased .................................. 9.0% 9.1% 8.1%
Gross cash collections (“GCC”) .............................. $ 655 $ 463 $ 348
Collections revenue ....................................... 129 217 199
Collections revenue as a % of GCC ........................... 20% 47% 56%
Carrying value of purchased paper ............................ $ 544 $ 587 $ 274
The decrease in collections revenue as a percentage of gross cash collections (“GCC”) in 2008 compared
to 2007 and 2006 was primarily due to the significant impairment recognized in 2008.
Purchased Paper — Mortgage/Properties
2008 2007 2006
Years Ended
December 31,
Face value of purchases for the period ........................... $ 39 $1,307 $556
Collections revenue, net of impairments .......................... (192) 52 40
Collateral value of purchases .................................. 29 1,171 607
Purchase price for the period .................................. 19 855 462
Purchase price as a % of collateral value ......................... 66% 73% 76%
Carrying value of purchases................................... $675 $1,162 $518
Carrying value of purchased paper as a % of collateral value . ......... 69% 77% 75%
84