Sallie Mae 2008 Annual Report Download - page 77
Download and view the complete annual report
Please find page 77 of the 2008 Sallie Mae annual report below. You can navigate through the pages in the report by either clicking on the pages listed below, or by using the keyword search tool below to find specific information within the annual report.-
 1
1 -
2
-
3
-
4
-
5
-
6
-
7
-
8
-
9
-
10
-
11
-
12
-
13
-
14
-
15
-
16
-
17
-
18
-
19
-
20
-
21
-
22
-
23
-
24
-
25
-
26
-
27
-
28
-
29
-
30
-
31
-
32
-
33
-
34
-
35
-
36
-
37
-
38
-
39
-
40
-
41
-
42
-
43
-
44
-
45
-
46
-
47
-
48
-
49
-
50
-
51
-
52
-
53
-
54
-
55
-
56
-
57
-
58
-
59
-
60
-
61
-
62
-
63
-
64
-
65
-
66
-
 67
67 -
 68
68 -
 69
69 -
 70
70 -
 71
71 -
 72
72 -
 73
73 -
 74
74 -
 75
75 -
 76
76 -
 77
77 -
 78
78 -
 79
79 -
 80
80 -
 81
81 -
 82
82 -
 83
83 -
 84
84 -
 85
85 -
 86
86 -
 87
87 -
88
-
89
-
90
-
91
-
92
-
93
-
94
-
95
-
96
-
97
-
98
-
99
-
100
-
101
-
102
-
103
-
104
-
105
-
106
-
107
-
108
-
109
-
110
-
111
-
112
-
113
-
114
-
115
-
116
-
117
-
118
-
119
-
120
-
121
-
122
-
123
-
124
-
125
-
126
-
127
-
128
-
129
-
130
-
131
-
132
-
133
-
134
-
135
-
136
-
137
-
138
-
139
-
140
-
141
-
142
-
143
-
144
-
145
-
146
-
147
-
148
-
149
-
150
-
151
-
152
-
153
-
154
-
155
-
156
-
157
-
158
-
159
-
160
-
161
-
162
-
163
-
164
-
165
-
166
-
167
-
168
-
169
-
170
-
171
-
172
-
173
-
174
-
175
-
176
-
177
-
178
-
179
-
180
-
181
-
182
-
183
-
184
-
185
-
186
-
187
-
188
-
189
-
190
-
191
-
192
-
193
-
194
-
195
-
196
-
197
-
198
-
199
-
200
-
201
-
202
-
203
-
204
-
205
-
206
-
207
-
208
-
209
-
210
-
211
-
212
-
213
-
214
-
215
-
216
-
217
-
218
-
219
-
220
-
221
-
222
-
223
-
224
-
225
-
226
-
227
-
228
-
229
-
230
-
231
-
232
-
233
-
234
-
235
-
236
-
237
-
238
-
239
-
240
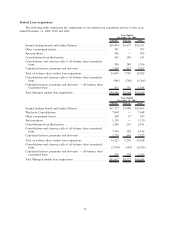
 |
 |

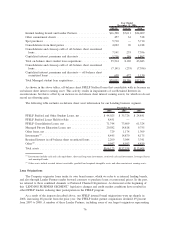
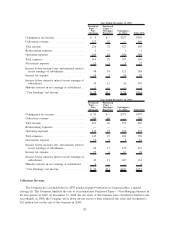
FFELP Private Total
Year Ended
December 31, 2006
Internal lending brands and Lender Partners ................... $16,398 $7,611 $24,009
Other commitment clients ................................ 457 61 518
Spot purchases ........................................ 5,710 — 5,710
Consolidations from third parties ........................... 4,092 96 4,188
Consolidations and clean-up calls of off-balance sheet securitized
loans .............................................. 7,141 255 7,396
Capitalized interest, premiums and discounts .................. 1,716 146 1,862
Total on-balance sheet student loan acquisitions ................ 35,514 8,169 43,683
Consolidations and clean-up calls of off-balance sheet securitized
loans .............................................. (7,141) (255) (7,396)
Capitalized interest, premiums and discounts — off-balance sheet
securitized loans ..................................... 658 472 1,130
Total Managed student loan acquisitions...................... $29,031 $8,386 $37,417
As shown in the above tables, off-balance sheet FFELP Stafford loans that consolidate with us become an
on-balance sheet interest earning asset. This activity results in impairments of our Retained Interests in
securitizations, but this is offset by an increase in on-balance sheet interest earning assets, for which we do not
record an offsetting gain.
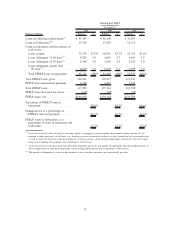
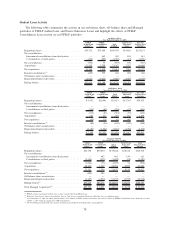
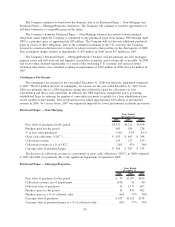
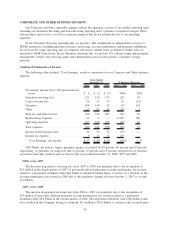
The following table includes on-balance sheet asset information for our Lending business segment.
2008 2007 2006
December 31,
FFELP Stafford and Other Student Loans, net .............. $ 44,025 $ 35,726 $ 24,841
FFELP Stafford Loans Held-for-Sale .................... 8,451 — —
FFELP Consolidation Loans, net ....................... 71,744 73,609 61,324
Managed Private Education Loans, net ................... 20,582 14,818 9,755
Other loans, net .................................... 729 1,174 1,309
Investments
(1)
...................................... 8,445 14,870 8,175
Retained Interest in off-balance sheet securitized loans ....... 2,200 3,044 3,341
Other
(2)
.......................................... 9,947 8,953 4,859
Total assets ....................................... $166,123 $152,194 $113,604
(1)
Investments include cash and cash equivalents, short and long-term investments, restricted cash and investments, leveraged leases,
and municipal bonds.
(2)
Other assets include accrued interest receivable, goodwill and acquired intangible assets and other non-interest earning assets.
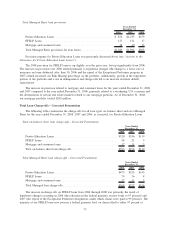
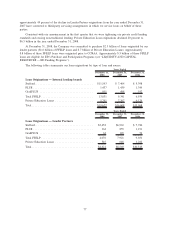
Loan Originations
The Company originates loans under its own brand names, which we refer to as internal lending brands,
and also through Lender Partners under forward contracts to purchase loans at contractual prices. In the past,
we referred to these combined channels as Preferred Channel Originations. As discussed at the beginning of
this “LENDING BUSINESS SEGMENT,” legislative changes and credit market conditions have resulted in
other FFELP lenders reducing their participation in the FFELP program.
As a result of the impacts described above, our FFELP internal brand originations were up sharply in
2008, increasing 48 percent from the prior year. Our FFELP lender partner originations declined 49 percent
from 2007 to 2008. A number of these Lender Partners, including some of our largest originators representing
76