Sallie Mae 2008 Annual Report Download - page 181
Download and view the complete annual report
Please find page 181 of the 2008 Sallie Mae annual report below. You can navigate through the pages in the report by either clicking on the pages listed below, or by using the keyword search tool below to find specific information within the annual report.-
 1
1 -
2
-
3
-
4
-
5
-
6
-
7
-
8
-
9
-
10
-
11
-
12
-
13
-
14
-
15
-
16
-
17
-
18
-
19
-
20
-
21
-
22
-
23
-
24
-
25
-
26
-
27
-
28
-
29
-
30
-
31
-
32
-
33
-
34
-
35
-
36
-
37
-
38
-
39
-
40
-
41
-
42
-
43
-
44
-
45
-
46
-
47
-
48
-
49
-
50
-
51
-
52
-
53
-
54
-
55
-
56
-
57
-
58
-
59
-
60
-
61
-
62
-
63
-
64
-
65
-
66
-
67
-
68
-
69
-
70
-
71
-
72
-
73
-
74
-
75
-
76
-
77
-
78
-
79
-
80
-
81
-
82
-
83
-
84
-
85
-
86
-
87
-
88
-
89
-
90
-
91
-
92
-
93
-
94
-
95
-
96
-
97
-
98
-
99
-
100
-
101
-
102
-
103
-
104
-
105
-
106
-
107
-
108
-
109
-
110
-
111
-
112
-
113
-
114
-
115
-
116
-
117
-
118
-
119
-
120
-
121
-
122
-
123
-
124
-
125
-
126
-
127
-
128
-
129
-
130
-
131
-
132
-
133
-
134
-
135
-
136
-
137
-
138
-
139
-
140
-
141
-
142
-
143
-
144
-
145
-
146
-
147
-
148
-
149
-
150
-
151
-
152
-
153
-
154
-
155
-
156
-
157
-
158
-
159
-
160
-
161
-
162
-
163
-
164
-
165
-
166
-
167
-
168
-
169
-
170
-
 171
171 -
 172
172 -
 173
173 -
 174
174 -
 175
175 -
 176
176 -
 177
177 -
 178
178 -
 179
179 -
 180
180 -
 181
181 -
 182
182 -
 183
183 -
 184
184 -
 185
185 -
 186
186 -
 187
187 -
 188
188 -
 189
189 -
 190
190 -
 191
191 -
192
-
193
-
194
-
195
-
196
-
197
-
198
-
199
-
200
-
201
-
202
-
203
-
204
-
205
-
206
-
207
-
208
-
209
-
210
-
211
-
212
-
213
-
214
-
215
-
216
-
217
-
218
-
219
-
220
-
221
-
222
-
223
-
224
-
225
-
226
-
227
-
228
-
229
-
230
-
231
-
232
-
233
-
234
-
235
-
236
-
237
-
238
-
239
-
240
 |
 |

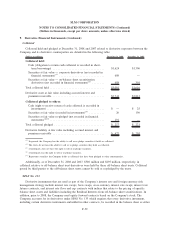
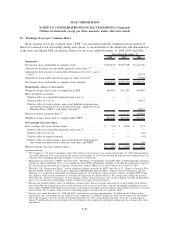
9. Derivative Financial Instruments (Continued)
fixed interest rate depending on market interest rates. The Company also has basis swaps that do not meet the
SFAS No. 133 effectiveness test that economically hedge off-balance sheet instruments. As a result, under
GAAP these swaps are recorded at fair value with changes in fair value reflected currently in the statement of
income.
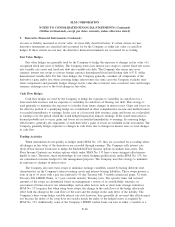
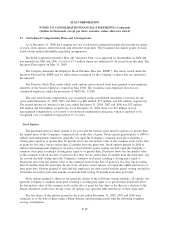
Prior to 2008, the Company entered into equity forward contracts (see Note 11, “Stockholders’ Equity,”
for a further discussion of equity forward contracts and the settlement of all equity forward contracts in
January 2008). The Company utilized the strategy to lock in the purchase price of the Company’s stock to
better manage the cost of its share repurchases. In order to qualify as a hedge under SFAS No. 133, the
hedged item must impact net income. In this case, the repurchase of the Company’s shares does not impact
net income; therefore, the equity forwards do not qualify as a SFAS No. 133 hedge. Prior to December 31,
2007, the Company’s equity forward contracts provided for physical, net share or net cash settlement options.
On December 31, 2007, the terms of the contracts were changed to allow for physical settlement only. This
effectively changed the characteristics of the contracts so they no longer were derivatives accounted for under
SFAS No. 133 and SFAS No. 150 and instead were accounted for as a liability (recorded at the present value
of the repurchase price) under SFAS No. 150. All contracts were settled in January 2008.
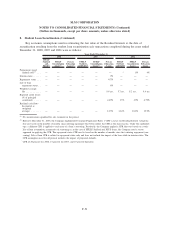
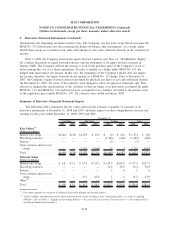
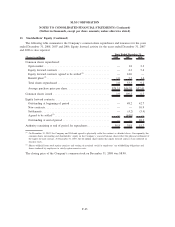
Summary of Derivative Financial Statement Impact
The following tables summarize the fair values and notional amounts or number of contracts of all
derivative instruments at December 31, 2008 and 2007, and their impact on other comprehensive income and
earnings for the years ended December 31, 2008, 2007 and 2006.
2008 2007 2008 2007 2008 2007 2008 2007
Cash Flow Fair Value Trading Total
December 31,
Fair Values
(1)
(Dollars in millions)
Interest rate swaps . . ....... $(146) $(34) $1,529 $ 102 $ (9) $ 252 $ 1,374 $ 320
Floor/Cap contracts . ....... — — — — (1,466) (442) (1,466) (442)
Futures.................. — — — — (3) — (3) —
Cross currency interest rate
swaps ................. — — 2,103 3,640 13 3 2,116 3,643
Total ................... $(146) $(34) $3,632 $3,742 $(1,465) $ (187) $ 2,021 $3,521
Notional Value
(Dollars in billions)
Interest rate swaps . . ....... $ 4.8 $3.1 $ 13.4 $ 14.7 $ 159.3 $199.5 $ 177.5 $217.3
Floor/Cap contracts . ....... — — — — 32.4 38.9 32.4 38.9
Futures.................. — — — — .2 .6 .2 .6
Cross currency interest rate
swaps ................. — — 23.1 23.8 .1 .1 23.2 23.9
Other
(2)
................. — — — — .7 .7 .7 .7
Total ................... $ 4.8 $3.1 $ 36.5 $ 38.5 $ 192.7 $239.8 $ 234.0 $281.4
(1)
Fair values reported are exclusive of collateral held and/or pledged and accrued interest.
(2)
“Other” includes embedded derivatives bifurcated from newly issued on-balance sheet securitization debt, as a result of adopting
SFAS No. 155 (see Note 2, “Significant Accounting Policies — Recently Issued Accounting Pronouncements — Accounting for Cer-
tain Hybrid Financial Instruments”).
F-61
SLM CORPORATION
NOTES TO CONSOLIDATED FINANCIAL STATEMENTS (Continued)
(Dollars in thousands, except per share amounts, unless otherwise stated)