Sallie Mae 2008 Annual Report Download - page 199
Download and view the complete annual report
Please find page 199 of the 2008 Sallie Mae annual report below. You can navigate through the pages in the report by either clicking on the pages listed below, or by using the keyword search tool below to find specific information within the annual report.-
 1
1 -
2
-
3
-
4
-
5
-
6
-
7
-
8
-
9
-
10
-
11
-
12
-
13
-
14
-
15
-
16
-
17
-
18
-
19
-
20
-
21
-
22
-
23
-
24
-
25
-
26
-
27
-
28
-
29
-
30
-
31
-
32
-
33
-
34
-
35
-
36
-
37
-
38
-
39
-
40
-
41
-
42
-
43
-
44
-
45
-
46
-
47
-
48
-
49
-
50
-
51
-
52
-
53
-
54
-
55
-
56
-
57
-
58
-
59
-
60
-
61
-
62
-
63
-
64
-
65
-
66
-
67
-
68
-
69
-
70
-
71
-
72
-
73
-
74
-
75
-
76
-
77
-
78
-
79
-
80
-
81
-
82
-
83
-
84
-
85
-
86
-
87
-
88
-
89
-
90
-
91
-
92
-
93
-
94
-
95
-
96
-
97
-
98
-
99
-
100
-
101
-
102
-
103
-
104
-
105
-
106
-
107
-
108
-
109
-
110
-
111
-
112
-
113
-
114
-
115
-
116
-
117
-
118
-
119
-
120
-
121
-
122
-
123
-
124
-
125
-
126
-
127
-
128
-
129
-
130
-
131
-
132
-
133
-
134
-
135
-
136
-
137
-
138
-
139
-
140
-
141
-
142
-
143
-
144
-
145
-
146
-
147
-
148
-
149
-
150
-
151
-
152
-
153
-
154
-
155
-
156
-
157
-
158
-
159
-
160
-
161
-
162
-
163
-
164
-
165
-
166
-
167
-
168
-
169
-
170
-
171
-
172
-
173
-
174
-
175
-
176
-
177
-
178
-
179
-
180
-
181
-
182
-
183
-
184
-
185
-
186
-
187
-
188
-
 189
189 -
 190
190 -
 191
191 -
 192
192 -
 193
193 -
 194
194 -
 195
195 -
 196
196 -
 197
197 -
 198
198 -
 199
199 -
 200
200 -
 201
201 -
 202
202 -
 203
203 -
 204
204 -
 205
205 -
 206
206 -
 207
207 -
 208
208 -
 209
209 -
210
-
211
-
212
-
213
-
214
-
215
-
216
-
217
-
218
-
219
-
220
-
221
-
222
-
223
-
224
-
225
-
226
-
227
-
228
-
229
-
230
-
231
-
232
-
233
-
234
-
235
-
236
-
237
-
238
-
239
-
240
 |
 |

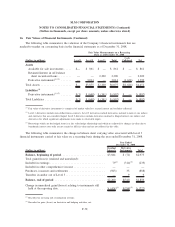
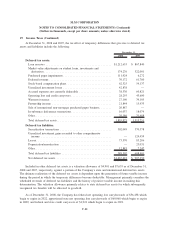
16. Fair Values of Financial Instruments (Continued)
The following table summarizes the valuation of the Company’s financial instruments that are
marked-to-market on a non-recurring basis by the above SFAS No. 157 pricing observable levels as of
December 31, 2008.
(Dollars in millions) Level 1 Level 2 Level 3 Total
Fair Value Measurements on a Non-Recurring
Basis as of December 31, 2008
FFELP Stafford Loans Held-for-Sale
(1)
.............. $462 $— $— $462
Total ....................................... $462 $— $— $462
(1)
Level 1 valuations reflect FFELP Stafford Loans Held-for-Sale under the various ED loan purchase programs.
In accordance with the provisions of SOP 01-6, “Accounting by Certain Entities (Including Entities with
Trade Receivables) That Lend to or Finance the Activities of Others,” FFELP Stafford Loans Held-for-Sale
with a carrying amount of $488 million were written down to their fair value of $462 million, resulting in an
impairment charge of $26 million which was included in earnings for the period.
The following table summarizes the fair values of the Company’s financial assets and liabilities, including
derivative financial instruments.
(Dollars in millions)
Fair
Value
Carrying
Value Difference
Fair
Value
Carrying
Value Difference
December 31, 2008 December 31, 2007
Earning assets
FFELP loans . . . . . . . . . . . . . . . . . . . . . . . . $107,319 $124,220 $(16,901) $111,552 $109,335 $ 2,217
Private Education Loans . . . . . . . . . . . . . . . . 14,141 20,582 (6,441) 17,289 14,818 2,471
Other loans . . . . . . . . . . . . . . . . . . . . . . . . . 619 729 (110) 1,175 1,173 2
Cash and investments . . . . . . . . . . . . . . . . . . 8,646 8,646 — 15,146 15,146 —
Total earning assets . . . . . . . . . . . . . . . . . . . 130,725 154,177 (23,452) 145,162 140,472 4,690
Interest-bearing liabilities
Short-term borrowings . . . . . . . . . . . . . . . . . 41,608 41,933 325 35,828 35,947 119
Long-term borrowings . . . . . . . . . . . . . . . . . 93,462 118,225 24,763 105,227 111,099 5,872
Total interest-bearing liabilities . . . . . . . . . . . 135,070 160,158 25,088 141,055 147,046 5,991
Derivative financial instruments
Floor Income/Cap contracts . . . . . . . . . . . . . (1,466) (1,466) — (442) (442) —
Interest rate swaps . . . . . . . . . . . . . . . . . . . . 1,374 1,374 — 320 320 —
Cross currency interest rate swaps . . . . . . . . . 2,116 2,116 — 3,643 3,643 —
Futures contracts . . . . . . . . . . . . . . . . . . . . . (3) (3) — — — —
Other
Residual interest in securitized assets . . . . . . . 2,200 2,200 — 3,044 3,044 —
Excess of net asset fair value over carrying
value . . . . . . . . . . . . . . . . . . . . . . . . . . . $ 1,636 $10,681
F-79
SLM CORPORATION
NOTES TO CONSOLIDATED FINANCIAL STATEMENTS (Continued)
(Dollars in thousands, except per share amounts, unless otherwise stated)