Sallie Mae 2008 Annual Report Download - page 51
Download and view the complete annual report
Please find page 51 of the 2008 Sallie Mae annual report below. You can navigate through the pages in the report by either clicking on the pages listed below, or by using the keyword search tool below to find specific information within the annual report.-
 1
1 -
2
-
3
-
4
-
5
-
6
-
7
-
8
-
9
-
10
-
11
-
12
-
13
-
14
-
15
-
16
-
17
-
18
-
19
-
20
-
21
-
22
-
23
-
24
-
25
-
26
-
27
-
28
-
29
-
30
-
31
-
32
-
33
-
34
-
35
-
36
-
37
-
38
-
39
-
40
-
 41
41 -
 42
42 -
 43
43 -
 44
44 -
 45
45 -
 46
46 -
 47
47 -
 48
48 -
 49
49 -
 50
50 -
 51
51 -
 52
52 -
 53
53 -
 54
54 -
 55
55 -
 56
56 -
 57
57 -
 58
58 -
 59
59 -
 60
60 -
 61
61 -
62
-
63
-
64
-
65
-
66
-
67
-
68
-
69
-
70
-
71
-
72
-
73
-
74
-
75
-
76
-
77
-
78
-
79
-
80
-
81
-
82
-
83
-
84
-
85
-
86
-
87
-
88
-
89
-
90
-
91
-
92
-
93
-
94
-
95
-
96
-
97
-
98
-
99
-
100
-
101
-
102
-
103
-
104
-
105
-
106
-
107
-
108
-
109
-
110
-
111
-
112
-
113
-
114
-
115
-
116
-
117
-
118
-
119
-
120
-
121
-
122
-
123
-
124
-
125
-
126
-
127
-
128
-
129
-
130
-
131
-
132
-
133
-
134
-
135
-
136
-
137
-
138
-
139
-
140
-
141
-
142
-
143
-
144
-
145
-
146
-
147
-
148
-
149
-
150
-
151
-
152
-
153
-
154
-
155
-
156
-
157
-
158
-
159
-
160
-
161
-
162
-
163
-
164
-
165
-
166
-
167
-
168
-
169
-
170
-
171
-
172
-
173
-
174
-
175
-
176
-
177
-
178
-
179
-
180
-
181
-
182
-
183
-
184
-
185
-
186
-
187
-
188
-
189
-
190
-
191
-
192
-
193
-
194
-
195
-
196
-
197
-
198
-
199
-
200
-
201
-
202
-
203
-
204
-
205
-
206
-
207
-
208
-
209
-
210
-
211
-
212
-
213
-
214
-
215
-
216
-
217
-
218
-
219
-
220
-
221
-
222
-
223
-
224
-
225
-
226
-
227
-
228
-
229
-
230
-
231
-
232
-
233
-
234
-
235
-
236
-
237
-
238
-
239
-
240
 |
 |
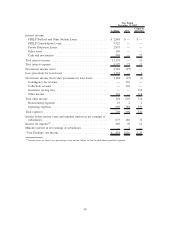
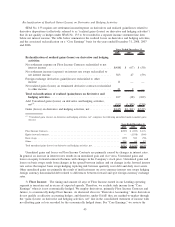
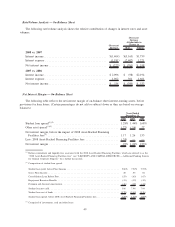
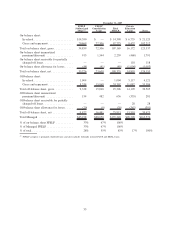
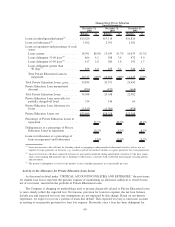
Student Loan Spread — On-Balance Sheet
The student loan spread is impacted by changes in its various components, as reflected in footnote (2) to
the “Net Interest Margin — On-Balance Sheet” table above. Gross Floor Income is impacted by interest rates
and the percentage of the FFELP portfolio eligible to earn Floor Income. The spread impact from Consolida-
tion Loan Rebate Fees fluctuates as a function of the percentage of FFELP Consolidation Loans on our
balance sheet. Repayment Borrower Benefits are generally impacted by the terms of the Repayment Borrower
Benefits being offered as well as the payment behavior of the underlying loans. Premium and discount
amortization is generally impacted by the prices previously paid for loans and amounts capitalized related to
such purchases or originations. Premium and discount amortization is also impacted by prepayment behavior
of the underlying loans.
The student loan spread, before 2008 Asset-Backed Financing Facilities fees, for 2008 decreased 16 basis
points from the prior year. The decrease was primarily due to an increase in our cost of funds, which was
partially offset by an increase in Floor Income due to a decrease in interest rates in 2008 compared to 2007.
The cost of funds for on-balance sheet student loans excludes the impact of basis swaps that are intended to
economically hedge the re-pricing and basis mismatch between our funding and student loan asset indices;
these swaps do not receive hedge accounting treatment under SFAS No. 133. We extensively use basis swaps
to manage our basis risk associated with our interest rate sensitive assets and liabilities. These swaps generally
do not qualify as accounting hedges, and as a result, are required to be accounted for in the “gains (losses) on
derivatives and hedging activities, net” line on the income statement, as opposed to being accounted for in
interest expense. As a result, these basis swaps are not considered in the calculation of the cost of funds in the
table above and therefore, in times of volatile movements of interest rates like those experienced in 2008, the
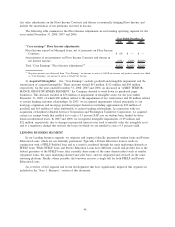
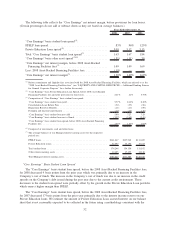
student loan spread can significantly change. See “‘Core Earnings’ Net Interest Margin” in the following
table, which reflects these basis swaps in interest expense and demonstrates the economic hedge effectiveness
of these basis swaps.
The decrease in our student loan spread, before the 2008 Asset-Backed Financing Facilities fees, for 2007
versus 2006 was primarily due to an increase in our cost of funds. The increase in the cost of funds is due to
the same reason discussed above related to 2008. See “‘Core Earnings’ Net Interest Margin — ‘Core
Earnings’ Basis Student Loan Spread,” which reflects these basis swaps in interest expense, and demonstrates
the economic hedge effectiveness of these basis swaps. The decrease in the student loan spread was also due
to an increase in the estimate of uncollectible accrued interest related to our Private Education Loans (see
“‘Core Earnings’ Net Interest Margin — ‘Core Earnings’ Basis Student Loan Spread”).
Other Asset Spread — On-Balance Sheet
The other asset spread is generated from cash and investments (both restricted and unrestricted) primarily
in our liquidity portfolio and other loans. The Company invests its liquidity portfolio primarily in short-term
securities with maturities of one week or less in order to manage counterparty credit risk and maintain
available cash balances. The other asset spread decreased 11 basis points from 2007 to 2008, and decreased
43 basis points from 2006 to 2007. Changes in the other asset spread primarily relate to differences in the
index basis and reset frequency between the asset indices and funding indices. A portion of this risk is hedged
with derivatives that do not receive hedge accounting treatment under SFAS No. 133 and will impact the other
asset spread in a similar fashion as the impact to the on-balance sheet student loan spread as discussed above.
In volatile interest rate environments, these spreads may move significantly from period to period and differ
from the “Core Earnings” basis other asset spread discussed below.
Net Interest Margin — On-Balance Sheet
The net interest margin, before 2008 Asset-Backed Financing Facilities fees, for 2008 decreased 9 basis
points from the year-ago period and decreased 27 basis points from 2006 to 2007. The increase in the student
loan portfolio as a percentage of the overall interest-earning asset portfolio from 2007 to 2008 resulted in an
increase to net interest margin of 7 basis points due to the student loan portfolio earning a higher spread than
the other asset portfolio. A decrease of 16 basis points relates primarily to the previous discussions of changes
50