Sallie Mae 2008 Annual Report Download - page 83
Download and view the complete annual report
Please find page 83 of the 2008 Sallie Mae annual report below. You can navigate through the pages in the report by either clicking on the pages listed below, or by using the keyword search tool below to find specific information within the annual report.-
 1
1 -
2
-
3
-
4
-
5
-
6
-
7
-
8
-
9
-
10
-
11
-
12
-
13
-
14
-
15
-
16
-
17
-
18
-
19
-
20
-
21
-
22
-
23
-
24
-
25
-
26
-
27
-
28
-
29
-
30
-
31
-
32
-
33
-
34
-
35
-
36
-
37
-
38
-
39
-
40
-
41
-
42
-
43
-
44
-
45
-
46
-
47
-
48
-
49
-
50
-
51
-
52
-
53
-
54
-
55
-
56
-
57
-
58
-
59
-
60
-
61
-
62
-
63
-
64
-
65
-
66
-
67
-
68
-
69
-
70
-
71
-
72
-
 73
73 -
 74
74 -
 75
75 -
 76
76 -
 77
77 -
 78
78 -
 79
79 -
 80
80 -
 81
81 -
 82
82 -
 83
83 -
 84
84 -
 85
85 -
 86
86 -
 87
87 -
 88
88 -
 89
89 -
 90
90 -
 91
91 -
 92
92 -
 93
93 -
94
-
95
-
96
-
97
-
98
-
99
-
100
-
101
-
102
-
103
-
104
-
105
-
106
-
107
-
108
-
109
-
110
-
111
-
112
-
113
-
114
-
115
-
116
-
117
-
118
-
119
-
120
-
121
-
122
-
123
-
124
-
125
-
126
-
127
-
128
-
129
-
130
-
131
-
132
-
133
-
134
-
135
-
136
-
137
-
138
-
139
-
140
-
141
-
142
-
143
-
144
-
145
-
146
-
147
-
148
-
149
-
150
-
151
-
152
-
153
-
154
-
155
-
156
-
157
-
158
-
159
-
160
-
161
-
162
-
163
-
164
-
165
-
166
-
167
-
168
-
169
-
170
-
171
-
172
-
173
-
174
-
175
-
176
-
177
-
178
-
179
-
180
-
181
-
182
-
183
-
184
-
185
-
186
-
187
-
188
-
189
-
190
-
191
-
192
-
193
-
194
-
195
-
196
-
197
-
198
-
199
-
200
-
201
-
202
-
203
-
204
-
205
-
206
-
207
-
208
-
209
-
210
-
211
-
212
-
213
-
214
-
215
-
216
-
217
-
218
-
219
-
220
-
221
-
222
-
223
-
224
-
225
-
226
-
227
-
228
-
229
-
230
-
231
-
232
-
233
-
234
-
235
-
236
-
237
-
238
-
239
-
240
 |
 |

ASSET PERFORMANCE GROUP (“APG”) BUSINESS SEGMENT
In our APG business segment, we provide a wide range of accounts receivable and collections services
including student loan default aversion services, defaulted student loan portfolio management services,
contingency collections services for student loans and other asset classes, and accounts receivable management
and collection for purchased portfolios of receivables that are delinquent or have been charged off by their
original creditors as well as sub-performing and non-performing mortgage loans. In the purchased receivables
business, we focus on a variety of consumer debt types with emphasis on charged off credit card receivables
and distressed mortgage receivables. We purchase these portfolios at a discount to their face value, and then
use both our internal collection operations coupled with third-party collection agencies to maximize the
recovery on these receivables.
An overview of this segment and recent developments that have significantly impacted this segment are
included in the “Item 1. Business” section of this document. The private sector collections industry is highly
fragmented with few large public companies and a large number of small scale privately-held companies. The
collections industry is highly competitive. We are responding to these competitive challenges through enhanced
servicing efficiencies and by continuing to build on customer relationships through value added services and
financings.
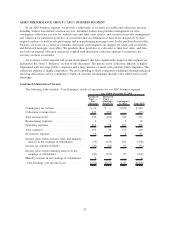
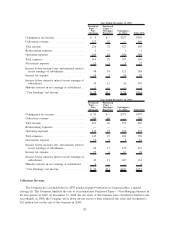
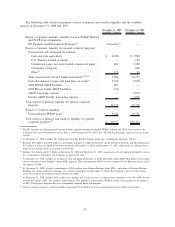
Condensed Statements of Income
The following tables include “Core Earnings” results of operations for our APG business segment.
Purchased
Paper —
Non-
Mortgage
Purchased
Paper —
Mortgage/
Properties
Contingency
& Other Total APG
Year Ended December 31, 2008
Contingency fee income .................... $ 10 $ — $330 $ 340
Collections revenue (loss) ................... 129 (192) — (63)
Total income (loss) ........................ 139 (192) 330 277
Restructuring expenses ..................... 6 1 5 12
Operating expenses........................ 193 38 167 398
Total expenses ........................... 199 39 172 410
Net interest expense ....................... 13 4 8 25
Income (loss) before income taxes and minority
interest in net earnings of subsidiaries ........ (73) (235) 150 (158)
Income tax expense (benefit) ................ (26) (83) 53 (56)
Income (loss) before minority interest in net
earnings of subsidiaries ................... (47) (152) 97 (102)
Minority interest in net earnings of subsidiaries . . . 4 — — 4
“Core Earnings” net income (loss) ............ $(51) $(152) $ 97 $(106)
82