Sallie Mae 2008 Annual Report Download - page 53
Download and view the complete annual report
Please find page 53 of the 2008 Sallie Mae annual report below. You can navigate through the pages in the report by either clicking on the pages listed below, or by using the keyword search tool below to find specific information within the annual report.-
 1
1 -
2
-
3
-
4
-
5
-
6
-
7
-
8
-
9
-
10
-
11
-
12
-
13
-
14
-
15
-
16
-
17
-
18
-
19
-
20
-
21
-
22
-
23
-
24
-
25
-
26
-
27
-
28
-
29
-
30
-
31
-
32
-
33
-
34
-
35
-
36
-
37
-
38
-
39
-
40
-
41
-
42
-
 43
43 -
 44
44 -
 45
45 -
 46
46 -
 47
47 -
 48
48 -
 49
49 -
 50
50 -
 51
51 -
 52
52 -
 53
53 -
 54
54 -
 55
55 -
 56
56 -
 57
57 -
 58
58 -
 59
59 -
 60
60 -
 61
61 -
 62
62 -
 63
63 -
64
-
65
-
66
-
67
-
68
-
69
-
70
-
71
-
72
-
73
-
74
-
75
-
76
-
77
-
78
-
79
-
80
-
81
-
82
-
83
-
84
-
85
-
86
-
87
-
88
-
89
-
90
-
91
-
92
-
93
-
94
-
95
-
96
-
97
-
98
-
99
-
100
-
101
-
102
-
103
-
104
-
105
-
106
-
107
-
108
-
109
-
110
-
111
-
112
-
113
-
114
-
115
-
116
-
117
-
118
-
119
-
120
-
121
-
122
-
123
-
124
-
125
-
126
-
127
-
128
-
129
-
130
-
131
-
132
-
133
-
134
-
135
-
136
-
137
-
138
-
139
-
140
-
141
-
142
-
143
-
144
-
145
-
146
-
147
-
148
-
149
-
150
-
151
-
152
-
153
-
154
-
155
-
156
-
157
-
158
-
159
-
160
-
161
-
162
-
163
-
164
-
165
-
166
-
167
-
168
-
169
-
170
-
171
-
172
-
173
-
174
-
175
-
176
-
177
-
178
-
179
-
180
-
181
-
182
-
183
-
184
-
185
-
186
-
187
-
188
-
189
-
190
-
191
-
192
-
193
-
194
-
195
-
196
-
197
-
198
-
199
-
200
-
201
-
202
-
203
-
204
-
205
-
206
-
207
-
208
-
209
-
210
-
211
-
212
-
213
-
214
-
215
-
216
-
217
-
218
-
219
-
220
-
221
-
222
-
223
-
224
-
225
-
226
-
227
-
228
-
229
-
230
-
231
-
232
-
233
-
234
-
235
-
236
-
237
-
238
-
239
-
240
 |
 |

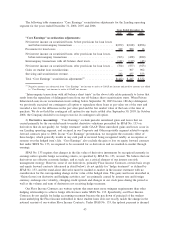
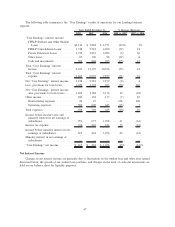
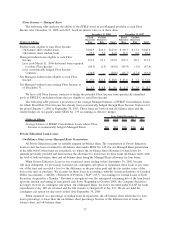
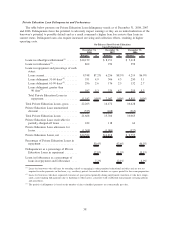
The following table reflects the “Core Earnings” net interest margin, before provisions for loan losses.
(Certain percentages do not add or subtract down as they are based on average balances.)
2008 2007 2006
Years Ended December 31,
“Core Earnings” basis student loan spread
(1)
:
FFELP loan spread ...................................... .83% .96% 1.25%
Private Education Loan spread
(2)
............................ 5.09 5.12 5.13
Total “Core Earnings” basis student loan spread
(3)
............... 1.63 1.67 1.84
“Core Earnings” basis other asset spread
(1)(4)
................... (.51) (.11) .30
“Core Earnings” net interest margin, before 2008 Asset-Backed
Financing Facilities fees
(1)
.............................. 1.49 1.49 1.69
Less: 2008 Asset-Backed Financing Facilities fees............... (.19) — —
“Core Earnings” net interest margin
(5)
........................ 1.30% 1.49% 1.69%
(1)
Before commitment and liquidity fees associated with the 2008 Asset-Backed Financing Facilities, which are referred to as the
“2008 Asset-Backed Financing Facilities fees” (see “LIQUIDITY AND CAPITAL RESOURCES — Additional Funding Sources
for General Corporate Purposes” for a further discussion).
(2)
“Core Earnings” basis Private Education Loan Spread, before 2008 Asset-Backed
Financing Facilities fees and after provision for loan losses . ............... 2.41% .41% 3.75%
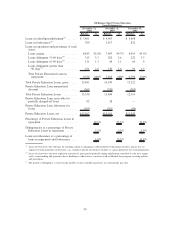
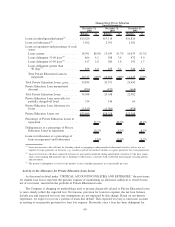
(3)
Composition of “Core Earnings” basis student loan spread:
“Core Earnings” basis student loan yield . . . ......................... 5.77% 8.12% 8.10%
Consolidation Loan Rebate Fees . . . .............................. (.52) (.57) (.56)
Repayment Borrower Benefits ................................... (.11) (.11) (.09)
Premium and discount amortization . .............................. (.14) (.17) (.16)
“Core Earnings” basis student loan net yield ......................... 5.00 7.27 7.29
“Core Earnings” basis student loan cost of funds. . . .................... (3.37) (5.60) (5.45)
“Core Earnings” basis student loan spread, before 2008 Asset-Backed Financing
Facilities fees ............................................. 1.63% 1.67% 1.84%
(4)
Comprised of investments, cash and other loans
(5)
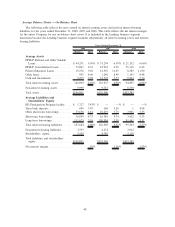
The average balances of our Managed interest-earning assets for the respective
periods are:
FFELP loans . ............................................. $141,647 $127,940 $111,469
Private Education Loans . . . ................................... 32,597 26,190 19,723
Total student loans . . ........................................ 174,244 154,130 131,192
Other interest-earning assets . ................................... 12,403 17,455 14,148
Total Managed interest-earning assets .............................. $186,647 $171,585 $145,340
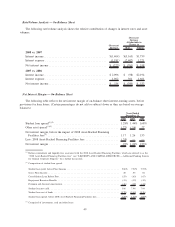
“Core Earnings” Basis Student Loan Spread
The “Core Earnings” basis student loan spread, before the 2008 Asset Backed Financing Facilities fees,
for 2008 decreased 4 basis points from the prior year which was primarily due to an increase in the
Company’s cost of funds. The increase in the Company’s cost of funds was due to an increase in the credit
spreads on the Company’s debt issued during the past year due to the current credit environment. These
decreases to the student loan spread were partially offset by the growth in the Private Education Loan portfolio
which earns a higher margin than FFELP.
The “Core Earnings” basis student loan spread, before the 2008 Asset-Backed Financing Facilities fees,
for 2007 decreased 17 basis points from the prior year primarily due to the interest income reserve on our
Private Education loans. We estimate the amount of Private Education Loan accrued interest on our balance
sheet that is not reasonably expected to be collected in the future using a methodology consistent with the
52