Sallie Mae 2008 Annual Report Download - page 42
Download and view the complete annual report
Please find page 42 of the 2008 Sallie Mae annual report below. You can navigate through the pages in the report by either clicking on the pages listed below, or by using the keyword search tool below to find specific information within the annual report.-
 1
1 -
2
-
3
-
4
-
5
-
6
-
7
-
8
-
9
-
10
-
11
-
12
-
13
-
14
-
15
-
16
-
17
-
18
-
19
-
20
-
21
-
22
-
23
-
24
-
25
-
26
-
27
-
28
-
29
-
30
-
31
-
 32
32 -
 33
33 -
 34
34 -
 35
35 -
 36
36 -
 37
37 -
 38
38 -
 39
39 -
 40
40 -
 41
41 -
 42
42 -
 43
43 -
 44
44 -
 45
45 -
 46
46 -
 47
47 -
 48
48 -
 49
49 -
 50
50 -
 51
51 -
 52
52 -
53
-
54
-
55
-
56
-
57
-
58
-
59
-
60
-
61
-
62
-
63
-
64
-
65
-
66
-
67
-
68
-
69
-
70
-
71
-
72
-
73
-
74
-
75
-
76
-
77
-
78
-
79
-
80
-
81
-
82
-
83
-
84
-
85
-
86
-
87
-
88
-
89
-
90
-
91
-
92
-
93
-
94
-
95
-
96
-
97
-
98
-
99
-
100
-
101
-
102
-
103
-
104
-
105
-
106
-
107
-
108
-
109
-
110
-
111
-
112
-
113
-
114
-
115
-
116
-
117
-
118
-
119
-
120
-
121
-
122
-
123
-
124
-
125
-
126
-
127
-
128
-
129
-
130
-
131
-
132
-
133
-
134
-
135
-
136
-
137
-
138
-
139
-
140
-
141
-
142
-
143
-
144
-
145
-
146
-
147
-
148
-
149
-
150
-
151
-
152
-
153
-
154
-
155
-
156
-
157
-
158
-
159
-
160
-
161
-
162
-
163
-
164
-
165
-
166
-
167
-
168
-
169
-
170
-
171
-
172
-
173
-
174
-
175
-
176
-
177
-
178
-
179
-
180
-
181
-
182
-
183
-
184
-
185
-
186
-
187
-
188
-
189
-
190
-
191
-
192
-
193
-
194
-
195
-
196
-
197
-
198
-
199
-
200
-
201
-
202
-
203
-
204
-
205
-
206
-
207
-
208
-
209
-
210
-
211
-
212
-
213
-
214
-
215
-
216
-
217
-
218
-
219
-
220
-
221
-
222
-
223
-
224
-
225
-
226
-
227
-
228
-
229
-
230
-
231
-
232
-
233
-
234
-
235
-
236
-
237
-
238
-
239
-
240
 |
 |

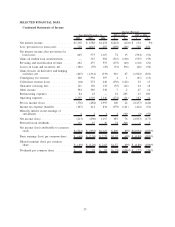
Lending APG
Corporate
and Other
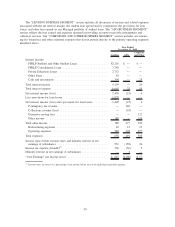
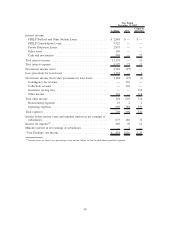
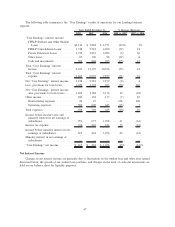
Year Ended
December 31, 2006
Interest income:
FFELP Stafford and Other Student Loans.................... $ 2,771 $ — $ —
FFELP Consolidation Loans ............................. 4,690 — —
Private Education Loans ................................ 2,092 — —
Other loans .......................................... 98 — —
Cash and investments .................................. 705 — 7
Total interest income ..................................... 10,356 — 7
Total interest expense .................................... 7,877 23 12
Net interest income (loss) ................................. 2,479 (23) (5)
Less: provisions for loan losses ............................. 303 — —
Net interest income (loss) after provisions for loan losses .......... 2,176 (23) (5)
Contingency fee revenue ................................ — 397 —
Collections revenue .................................... — 239 —
Guarantor servicing fees ................................ — — 132
Other income ........................................ 177 — 155
Total other income ...................................... 177 636 287
Restructuring expenses ................................. — — —
Operating expenses .................................... 645 358 250
Total expenses ......................................... 645 358 250
Income before income taxes and minority interest in net earnings of
subsidiaries .......................................... 1,708 255 32
Income tax expense
(1)
.................................... 632 94 12
Minority interest in net earnings of subsidiaries ................. — 4 —
“Core Earnings” net income ............................... $ 1,076 $157 $ 20
(1)
Income taxes are based on a percentage of net income before tax for the individual reportable segment.
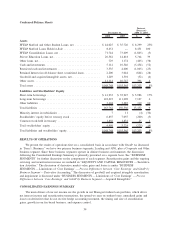
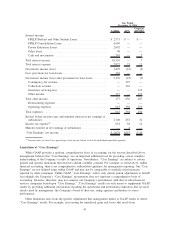
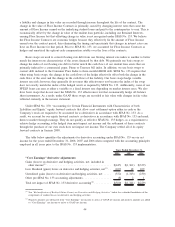
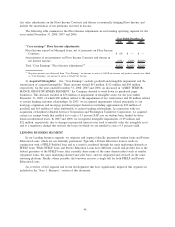
Limitations of “Core Earnings”
While GAAP provides a uniform, comprehensive basis of accounting, for the reasons described above,
management believes that “Core Earnings” are an important additional tool for providing a more complete
understanding of the Company’s results of operations. Nevertheless, “Core Earnings” are subject to certain
general and specific limitations that investors should carefully consider. For example, as stated above, unlike
financial accounting, there is no comprehensive, authoritative guidance for management reporting. Our “Core
Earnings” are not defined terms within GAAP and may not be comparable to similarly titled measures
reported by other companies. Unlike GAAP, “Core Earnings” reflect only current period adjustments to GAAP.
Accordingly, the Company’s “Core Earnings” presentation does not represent a comprehensive basis of
accounting. Investors, therefore, may not compare our Company’s performance with that of other financial
services companies based upon “Core Earnings.” “Core Earnings” results are only meant to supplement GAAP
results by providing additional information regarding the operational and performance indicators that are most
closely used by management, the Company’s board of directors, rating agencies and lenders to assess
performance.
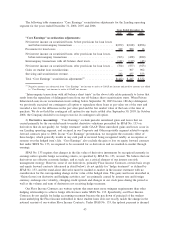
Other limitations arise from the specific adjustments that management makes to GAAP results to derive
“Core Earnings” results. For example, in reversing the unrealized gains and losses that result from
41