Sallie Mae 2008 Annual Report Download - page 128
Download and view the complete annual report
Please find page 128 of the 2008 Sallie Mae annual report below. You can navigate through the pages in the report by either clicking on the pages listed below, or by using the keyword search tool below to find specific information within the annual report.-
 1
1 -
2
-
3
-
4
-
5
-
6
-
7
-
8
-
9
-
10
-
11
-
12
-
13
-
14
-
15
-
16
-
17
-
18
-
19
-
20
-
21
-
22
-
23
-
24
-
25
-
26
-
27
-
28
-
29
-
30
-
31
-
32
-
33
-
34
-
35
-
36
-
37
-
38
-
39
-
40
-
41
-
42
-
43
-
44
-
45
-
46
-
47
-
48
-
49
-
50
-
51
-
52
-
53
-
54
-
55
-
56
-
57
-
58
-
59
-
60
-
61
-
62
-
63
-
64
-
65
-
66
-
67
-
68
-
69
-
70
-
71
-
72
-
73
-
74
-
75
-
76
-
77
-
78
-
79
-
80
-
81
-
82
-
83
-
84
-
85
-
86
-
87
-
88
-
89
-
90
-
91
-
92
-
93
-
94
-
95
-
96
-
97
-
98
-
99
-
100
-
101
-
102
-
103
-
104
-
105
-
106
-
107
-
108
-
109
-
110
-
111
-
112
-
113
-
114
-
115
-
116
-
117
-
 118
118 -
 119
119 -
 120
120 -
 121
121 -
 122
122 -
 123
123 -
 124
124 -
 125
125 -
 126
126 -
 127
127 -
 128
128 -
 129
129 -
 130
130 -
 131
131 -
 132
132 -
 133
133 -
 134
134 -
 135
135 -
 136
136 -
 137
137 -
 138
138 -
139
-
140
-
141
-
142
-
143
-
144
-
145
-
146
-
147
-
148
-
149
-
150
-
151
-
152
-
153
-
154
-
155
-
156
-
157
-
158
-
159
-
160
-
161
-
162
-
163
-
164
-
165
-
166
-
167
-
168
-
169
-
170
-
171
-
172
-
173
-
174
-
175
-
176
-
177
-
178
-
179
-
180
-
181
-
182
-
183
-
184
-
185
-
186
-
187
-
188
-
189
-
190
-
191
-
192
-
193
-
194
-
195
-
196
-
197
-
198
-
199
-
200
-
201
-
202
-
203
-
204
-
205
-
206
-
207
-
208
-
209
-
210
-
211
-
212
-
213
-
214
-
215
-
216
-
217
-
218
-
219
-
220
-
221
-
222
-
223
-
224
-
225
-
226
-
227
-
228
-
229
-
230
-
231
-
232
-
233
-
234
-
235
-
236
-
237
-
238
-
239
-
240
 |
 |

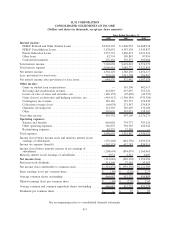
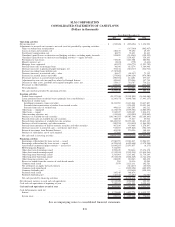
SLM CORPORATION
CONSOLIDATED STATEMENTS OF CASH FLOWS
(Dollars in thousands)
2008 2007 2006
Years Ended December 31,
Operating activities
Net income (loss) ................................................... $ (212,626) $ (896,394) $ 1,156,956
Adjustments to reconcile net income to net cash (used in) provided by operating activities:
Gains on student loan securitizations ..................................... — (367,300) (902,417)
Losses on loans and securities, net ...................................... 186,155 95,492 49,357
Stock-based compensation cost ......................................... 86,271 74,621 81,163
Unrealized (gains)/losses on derivative and hedging activities, excluding equity forwards..... 559,895 (214,963) (128,529)
Unrealized (gains)/losses on derivative and hedging activities — equity forwards .......... — 1,558,025 359,193
Provisions for loan losses ............................................ 719,650 1,015,308 286,962
Minority interest, net ............................................... (2,674) (779) (2,461)
Mortgage loans originated ............................................ (60,927) (546,773) (1,291,782)
Proceeds from sales of mortgage loans .................................... 66,396 615,274 1,364,448
Decrease (increase) in purchased paper-mortgages, net . ......................... 301,234 (618,117) (214,916)
(Increase) in student loans held-for-sale ................................... (7,787,869) — —
Decrease (increase) in restricted cash — other ............................... 96,617 (84,537) 71,312
(Increase) in accrued interest receivable ................................... (279,082) (1,046,124) (970,580)
(Decrease) increase in accrued interest payable ............................... (200,501) 214,401 277,617
Adjustment for non-cash (income)/loss related to Retained Interest .................. 425,462 279,246 157,715
Decrease in other assets, goodwill and acquired intangible assets, net ................. 559,417 761,787 730,221
(Decrease) in other liabilities .......................................... (155,768) (890,464) (215,838)
Total adjustments ................................................. (5,485,724) 845,097 (348,535)
Net cash (used in) provided by operating activities . . . ......................... (5,698,350) (51,297) 808,421
Investing activities
Student loans acquired .............................................. (23,337,946) (39,303,005) (36,364,686)
Loans purchased from securitized trusts (primarily loan consolidations) ............... (1,243,671) (4,448,766) (7,443,157)
Reduction of student loans:
Installment payments, claims and other .................................. 10,333,901 11,413,044 10,617,867
Proceeds from securitization of student loans treated as sales .................... — 1,976,599 19,521,365
Proceeds from sales of student loans .................................... 496,183 1,013,295 101,212
Other loans — originated ............................................ (1,138,355) (3,396,501) (2,082,670)
Other loans — repaid ............................................... 1,542,307 3,420,187 1,834,471
Other investing activities, net .......................................... (135,041) (358,209) (210,969)
Purchases of available-for-sale securities ................................... (101,140,587) (90,087,504) (85,189,100)
Proceeds from sales of available-for-sale securities . . . ......................... 328,530 73,217 25,941
Proceeds from maturities of available-for-sale securities ......................... 102,436,912 89,353,103 85,015,345
Purchases of held-to-maturity and other securities ............................. (500,255) (330,450) (1,066,290)
Proceeds from maturities of held-to-maturity securities and other securities ............. 407,180 435,468 1,278,897
Decrease (increase) in restricted cash — on-balance sheet trusts .................... 918,403 (1,293,846) (304,749)
Return of investment from Retained Interest................................. 403,020 276,996 140,435
Purchase of subsidiaries, net of cash acquired ................................ (37,868) — (339,836)
Net cash used in investing activities ...................................... (10,667,287) (31,256,372) (14,465,924)
Financing activities
Borrowings collateralized by loans in trust — issued . . ......................... 17,986,955 23,943,837 12,984,937
Borrowings collateralized by loans in trust — repaid . . ......................... (6,299,483) (6,429,648) (5,578,268)
Asset-backed commercial paper conduits — net activity ......................... (1,649,287) 21,073,857 (6,173)
ED Participation Program ............................................ 7,364,969 — —
Other short-term borrowings issued ...................................... 2,592,429 594,434 15,374,178
Other short-term borrowings repaid ...................................... (1,512,031) (2,342,953) (15,434,264)
Other long-term borrowings issued ...................................... 3,563,003 1,567,602 11,739,249
Other long-term borrowings repaid ...................................... (9,518,655) (3,188,249) (4,744,432)
Other financing activities, net .......................................... 284,659 901,263 202,452
Excess tax benefit from the exercise of stock-based awards ....................... 281 30,316 32,985
Common stock issued .............................................. 5,979 2,125,111 192,520
Net settlements on equity forward contracts ................................. — (614,217) (66,925)
Common stock repurchased ........................................... — (2,222,394) (482,855)
Common dividends paid ............................................. — (102,658) (398,414)
Preferred stock issued .............................................. 145,345 968,674 —
Preferred dividends paid ............................................. (110,556) (36,497) (34,920)
Net cash provided by financing activities .................................. 12,853,608 36,268,478 13,780,070
Net (decrease) increase in cash and cash equivalents ............................. (3,512,029) 4,960,809 122,567
Cash and cash equivalents at beginning of year ................................ 7,582,031 2,621,222 2,498,655
Cash and cash equivalents at end of year .................................. $ 4,070,002 $ 7,582,031 $ 2,621,222
Cash disbursements made for:
Interest ........................................................ $ 5,721,408 $ 6,897,773 $ 4,512,737
Income taxes .................................................... $ 699,364 $ 1,097,340 $ 770,004
See accompanying notes to consolidated financial statements.
F-8