Sallie Mae 2008 Annual Report Download - page 82
Download and view the complete annual report
Please find page 82 of the 2008 Sallie Mae annual report below. You can navigate through the pages in the report by either clicking on the pages listed below, or by using the keyword search tool below to find specific information within the annual report.-
 1
1 -
2
-
3
-
4
-
5
-
6
-
7
-
8
-
9
-
10
-
11
-
12
-
13
-
14
-
15
-
16
-
17
-
18
-
19
-
20
-
21
-
22
-
23
-
24
-
25
-
26
-
27
-
28
-
29
-
30
-
31
-
32
-
33
-
34
-
35
-
36
-
37
-
38
-
39
-
40
-
41
-
42
-
43
-
44
-
45
-
46
-
47
-
48
-
49
-
50
-
51
-
52
-
53
-
54
-
55
-
56
-
57
-
58
-
59
-
60
-
61
-
62
-
63
-
64
-
65
-
66
-
67
-
68
-
69
-
70
-
71
-
 72
72 -
 73
73 -
 74
74 -
 75
75 -
 76
76 -
 77
77 -
 78
78 -
 79
79 -
 80
80 -
 81
81 -
 82
82 -
 83
83 -
 84
84 -
 85
85 -
 86
86 -
 87
87 -
 88
88 -
 89
89 -
 90
90 -
 91
91 -
 92
92 -
93
-
94
-
95
-
96
-
97
-
98
-
99
-
100
-
101
-
102
-
103
-
104
-
105
-
106
-
107
-
108
-
109
-
110
-
111
-
112
-
113
-
114
-
115
-
116
-
117
-
118
-
119
-
120
-
121
-
122
-
123
-
124
-
125
-
126
-
127
-
128
-
129
-
130
-
131
-
132
-
133
-
134
-
135
-
136
-
137
-
138
-
139
-
140
-
141
-
142
-
143
-
144
-
145
-
146
-
147
-
148
-
149
-
150
-
151
-
152
-
153
-
154
-
155
-
156
-
157
-
158
-
159
-
160
-
161
-
162
-
163
-
164
-
165
-
166
-
167
-
168
-
169
-
170
-
171
-
172
-
173
-
174
-
175
-
176
-
177
-
178
-
179
-
180
-
181
-
182
-
183
-
184
-
185
-
186
-
187
-
188
-
189
-
190
-
191
-
192
-
193
-
194
-
195
-
196
-
197
-
198
-
199
-
200
-
201
-
202
-
203
-
204
-
205
-
206
-
207
-
208
-
209
-
210
-
211
-
212
-
213
-
214
-
215
-
216
-
217
-
218
-
219
-
220
-
221
-
222
-
223
-
224
-
225
-
226
-
227
-
228
-
229
-
230
-
231
-
232
-
233
-
234
-
235
-
236
-
237
-
238
-
239
-
240
 |
 |

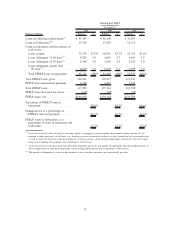
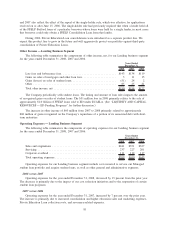
and 2007 also reflect the effect of the repeal of the single-holder rule, which was effective for applications
received on or after June 15, 2006. The single-holder rule had previously required that when a lender held all
of the FFELP Stafford loans of a particular borrower whose loans were held by a single lender, in most cases
that borrower could only obtain a FFELP Consolidation Loan from that lender.
During 2006, Private Education Loan consolidations were introduced as a separate product line. We
expect this product line to grow in the future and will aggressively protect our portfolio against third-party
consolidation of Private Education Loans.
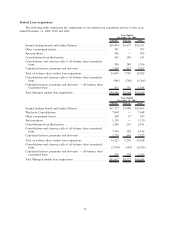
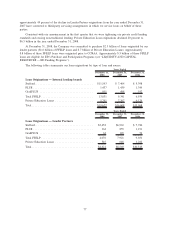
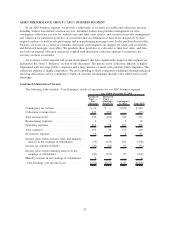
Other Income — Lending Business Segment
The following table summarizes the components of other income, net, for our Lending business segment
for the years ended December 31, 2008, 2007 and 2006.
2008 2007 2006
Years Ended
December 31,
Late fees and forbearance fees ................................... $143 $134 $119
Gains on sales of mortgages and other loan fees...................... 3 11 15
Gains (losses) on sales of student loans ............................ (51) 24 2
Other ..................................................... 85 25 41
Total other income, net ........................................ $180 $194 $177
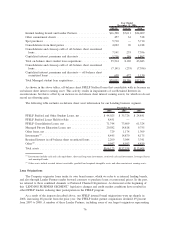
The Company periodically sells student loans. The timing and amount of loan sales impacts the amount
of recognized gains on sales of student loans. The $51 million loss in 2008 primarily relates to the sale of
approximately $1.0 billion of FFELP loans sold to ED under ECASLA. (See “LIQUIDITY AND CAPITAL
RESOURCES — ED Funding Programs” for further discussion.)
The increase in other income of $60 million from 2007 to 2008 primarily related to approximately
$68 million of gains recognized on the Company’s repurchase of a portion of its unsecured debt with short-
term maturities.
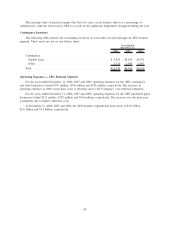
Operating Expenses — Lending Business Segment
The following table summarizes the components of operating expenses for our Lending business segment
for the years ended December 31, 2008, 2007 and 2006.
2008 2007 2006
Years Ended
December 31,
Sales and originations ......................................... $241 $351 $327
Servicing .................................................. 237 227 201
Corporate overhead ........................................... 111 112 117
Total operating expenses ....................................... $589 $690 $645
Operating expenses for our Lending business segment include costs incurred to service our Managed
student loan portfolio and acquire student loans, as well as other general and administrative expenses.
2008 versus 2007
Operating expenses for the year ended December 31, 2008, decreased by 15 percent from the prior year.
The decrease is primarily due to the impact of our cost reduction initiatives and to the suspension of certain
student loan programs.
2007 versus 2006
Operating expenses for the year ended December 31, 2007, increased by 7 percent over the prior year.
The increase is primarily due to increased consolidation and higher education sales and marketing expenses,
Private Education Loan collection costs, and severance-related expenses.
81