Sallie Mae 2008 Annual Report Download - page 173
Download and view the complete annual report
Please find page 173 of the 2008 Sallie Mae annual report below. You can navigate through the pages in the report by either clicking on the pages listed below, or by using the keyword search tool below to find specific information within the annual report.-
 1
1 -
2
-
3
-
4
-
5
-
6
-
7
-
8
-
9
-
10
-
11
-
12
-
13
-
14
-
15
-
16
-
17
-
18
-
19
-
20
-
21
-
22
-
23
-
24
-
25
-
26
-
27
-
28
-
29
-
30
-
31
-
32
-
33
-
34
-
35
-
36
-
37
-
38
-
39
-
40
-
41
-
42
-
43
-
44
-
45
-
46
-
47
-
48
-
49
-
50
-
51
-
52
-
53
-
54
-
55
-
56
-
57
-
58
-
59
-
60
-
61
-
62
-
63
-
64
-
65
-
66
-
67
-
68
-
69
-
70
-
71
-
72
-
73
-
74
-
75
-
76
-
77
-
78
-
79
-
80
-
81
-
82
-
83
-
84
-
85
-
86
-
87
-
88
-
89
-
90
-
91
-
92
-
93
-
94
-
95
-
96
-
97
-
98
-
99
-
100
-
101
-
102
-
103
-
104
-
105
-
106
-
107
-
108
-
109
-
110
-
111
-
112
-
113
-
114
-
115
-
116
-
117
-
118
-
119
-
120
-
121
-
122
-
123
-
124
-
125
-
126
-
127
-
128
-
129
-
130
-
131
-
132
-
133
-
134
-
135
-
136
-
137
-
138
-
139
-
140
-
141
-
142
-
143
-
144
-
145
-
146
-
147
-
148
-
149
-
150
-
151
-
152
-
153
-
154
-
155
-
156
-
157
-
158
-
159
-
160
-
161
-
162
-
 163
163 -
 164
164 -
 165
165 -
 166
166 -
 167
167 -
 168
168 -
 169
169 -
 170
170 -
 171
171 -
 172
172 -
 173
173 -
 174
174 -
 175
175 -
 176
176 -
 177
177 -
 178
178 -
 179
179 -
 180
180 -
 181
181 -
 182
182 -
 183
183 -
184
-
185
-
186
-
187
-
188
-
189
-
190
-
191
-
192
-
193
-
194
-
195
-
196
-
197
-
198
-
199
-
200
-
201
-
202
-
203
-
204
-
205
-
206
-
207
-
208
-
209
-
210
-
211
-
212
-
213
-
214
-
215
-
216
-
217
-
218
-
219
-
220
-
221
-
222
-
223
-
224
-
225
-
226
-
227
-
228
-
229
-
230
-
231
-
232
-
233
-
234
-
235
-
236
-
237
-
238
-
239
-
240
 |
 |

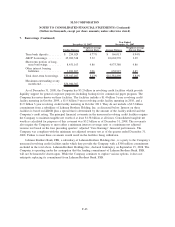
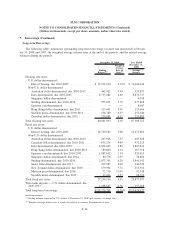
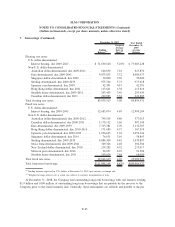
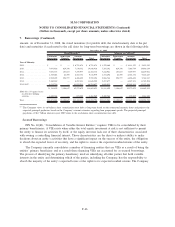
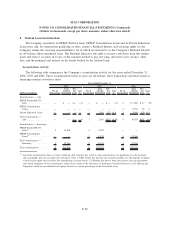
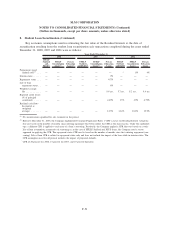
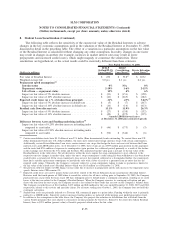
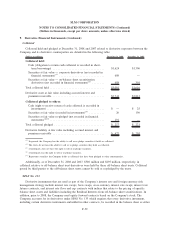
8. Student Loan Securitization (Continued)
Residual Interest in Securitized Receivables
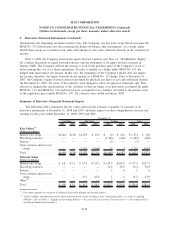
The following tables summarize the fair value of the Company’s Residual Interests included in the
Company’s Retained Interest (and the assumptions used to value such Residual Interests), along with the
underlying off-balance sheet student loans that relate to those securitizations in transactions that were treated
as sales as of December 31, 2008 and 2007.
(Dollars in millions)
FFELP
Stafford and
PLUS
Consolidation
Loan
Trusts
(1)
Private
Education
Loan Trusts Total
As of December 31, 2008
Fair value of Residual Interests
(2)
. . . . . . . . . . . . . . . . $ 250 $ 918 $ 1,032 $ 2,200
Underlying securitized loan balance . . . . . . . . . . . . . . 7,057 15,077 13,690 35,824
Weighted average life . . . . . . . . . . . . . . . . . . . . . . . . 3.0 yrs. 8.1 yrs. 6.4 yrs.
Prepayment speed (annual rate)
(3)
................
Interim status . . . . . . . . . . . . . . . . . . . . . . . . . . . . 0% N/A 0%
Repayment status . . . . . . . . . . . . . . . . . . . . . . . . . 2-19% 1-6% 2-15%
Life of loan — repayment status . . . . . . . . . . . . . . . 12% 4% 6%
Expected credit losses (% of student loan principal)
(4)
. . .11% .23% 5.22%
Residual cash flows discount rate . . . . . . . . . . . . . . . . 13.1% 11.9% 26.3%
(Dollars in millions)
FFELP
Stafford and
PLUS
Consolidation
Loan
Trusts
(1)
Private
Education
Loan Trusts Total
As of December 31, 2007
Fair value of Residual Interests
(2)
. . . . . . . . . . . . . . . . . . . $ 390 $ 730 $ 1,924 $ 3,044
Underlying securitized loan balance . . . . . . . . . . . . . . . . . . 9,338 15,968 14,199 39,505
Weighted average life. . . . . . . . . . . . . . . . . . . . . . . . . . . . 2.7 yrs. 7.4 yrs. 7.0 yrs.
Prepayment speed (annual rate)
(3)
...................
Interim status . . . . . . . . . . . . . . . . . . . . . . . . . . . . . . . . 0% N/A 0%
Repayment status . . . . . . . . . . . . . . . . . . . . . . . . . . . . . 0-37% 3-8% 1-30%
Life of loan — repayment status . . . . . . . . . . . . . . . . . . 21% 6% 9%
Expected credit losses (% of student loan principal)
(4)
. . . . . .11% .21% 5.28%
Residual cash flows discount rate . . . . . . . . . . . . . . . . . . . 12.0% 9.8% 12.9%
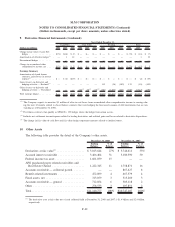
(1)
Includes $762 million and $283 million related to the fair value of the Embedded Floor Income as of December 31, 2008 and
2007, respectively. Changes in the fair value of the Embedded Floor Income are primarily due to changes in the interest rates
and the paydown of the underlying loans.
(2)
At December 31, 2007, the Company had unrealized gains (pre-tax) in accumulated other comprehensive income of $301 million
that related to the Retained Interests. There were no such gains at December 31, 2008.
(3)
The Company uses CPR curves for Residual Interest valuations that are based on seasoning (the number of months since enter-
ing repayment). Under this methodology, a different CPR is applied to each year of a loan’s seasoning. The repayment status
CPR used is based on the number of months since first entering repayment (seasoning). Life of loan CPR is related to repayment
status only and does not include the impact of the loan while in interim status. The CPR assumption used for all periods includes
the impact of projected defaults.
(4)
Remaining expected credit losses as of the respective balance sheet date.
Servicing and securitization revenue is primarily driven by the average balance of off-balance sheet
student loans, the amount of and the difference in the timing of Embedded Floor Income recognition on off-
balance sheet student loans, and the fair value adjustment related to those Residual Interests where the
Company has elected to carry such Residual Interests at fair value through earnings under SFAS No. 159.
F-53
SLM CORPORATION
NOTES TO CONSOLIDATED FINANCIAL STATEMENTS (Continued)
(Dollars in thousands, except per share amounts, unless otherwise stated)