Sallie Mae 2008 Annual Report Download - page 75
Download and view the complete annual report
Please find page 75 of the 2008 Sallie Mae annual report below. You can navigate through the pages in the report by either clicking on the pages listed below, or by using the keyword search tool below to find specific information within the annual report.-
 1
1 -
2
-
3
-
4
-
5
-
6
-
7
-
8
-
9
-
10
-
11
-
12
-
13
-
14
-
15
-
16
-
17
-
18
-
19
-
20
-
21
-
22
-
23
-
24
-
25
-
26
-
27
-
28
-
29
-
30
-
31
-
32
-
33
-
34
-
35
-
36
-
37
-
38
-
39
-
40
-
41
-
42
-
43
-
44
-
45
-
46
-
47
-
48
-
49
-
50
-
51
-
52
-
53
-
54
-
55
-
56
-
57
-
58
-
59
-
60
-
61
-
62
-
63
-
64
-
 65
65 -
 66
66 -
 67
67 -
 68
68 -
 69
69 -
 70
70 -
 71
71 -
 72
72 -
 73
73 -
 74
74 -
 75
75 -
 76
76 -
 77
77 -
 78
78 -
 79
79 -
 80
80 -
 81
81 -
 82
82 -
 83
83 -
 84
84 -
 85
85 -
86
-
87
-
88
-
89
-
90
-
91
-
92
-
93
-
94
-
95
-
96
-
97
-
98
-
99
-
100
-
101
-
102
-
103
-
104
-
105
-
106
-
107
-
108
-
109
-
110
-
111
-
112
-
113
-
114
-
115
-
116
-
117
-
118
-
119
-
120
-
121
-
122
-
123
-
124
-
125
-
126
-
127
-
128
-
129
-
130
-
131
-
132
-
133
-
134
-
135
-
136
-
137
-
138
-
139
-
140
-
141
-
142
-
143
-
144
-
145
-
146
-
147
-
148
-
149
-
150
-
151
-
152
-
153
-
154
-
155
-
156
-
157
-
158
-
159
-
160
-
161
-
162
-
163
-
164
-
165
-
166
-
167
-
168
-
169
-
170
-
171
-
172
-
173
-
174
-
175
-
176
-
177
-
178
-
179
-
180
-
181
-
182
-
183
-
184
-
185
-
186
-
187
-
188
-
189
-
190
-
191
-
192
-
193
-
194
-
195
-
196
-
197
-
198
-
199
-
200
-
201
-
202
-
203
-
204
-
205
-
206
-
207
-
208
-
209
-
210
-
211
-
212
-
213
-
214
-
215
-
216
-
217
-
218
-
219
-
220
-
221
-
222
-
223
-
224
-
225
-
226
-
227
-
228
-
229
-
230
-
231
-
232
-
233
-
234
-
235
-
236
-
237
-
238
-
239
-
240
 |
 |

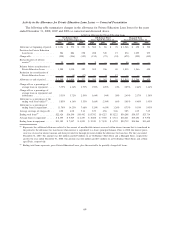
98 percent depending on date of disbursement. The increase in charge-offs is also due to the continued
weakening of the U.S. economy. See “Private Education Loan Losses — Activity in the Allowance for Private
Education Loan Losses” above for a discussion of net charge-offs related to our Private Education Loans.
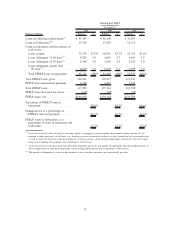
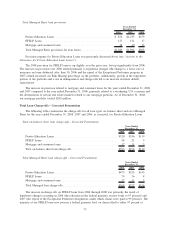
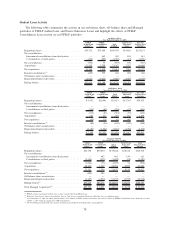
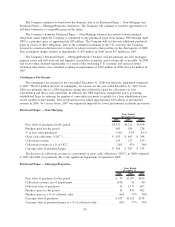
Student Loan Premiums as a Percentage of Principal
The following table presents student loan premiums paid as a percentage of the principal balance of
student loans acquired for the respective periods.
Volume Rate Volume Rate Volume Rate
2008 2007 2006
Years Ended December 31,
Student loan premiums paid:
Internal lending brands — FFELP ........ $13,272 1.69% $ 8,544 2.67% $ 6,339 1.81%
Internal lending brands — Private ........ 5,749 — 7,193 — 5,932 .01
Lender Partners — FFELP ............. 6,622 3.00 9,033 3.14 10,059 2.29
Lender Partners — Private ............. 688 — 695 .02 1,679 .01
Total ............................. 26,331 1.61 25,465 2.01 24,009 1.44
Other purchases
(1)
................... 907 1.26 8,473 4.16 6,228 4.39
Subtotal base purchases ............... 27,238 1.59 33,938 2.54 30,237 2.05
Consolidation originations ............. 611 1.98 2,441 2.72 4,188 2.54
Total ............................. $27,849 1.60% $36,379 2.56% $34,425 2.11%
(1)
Primarily includes spot purchases (including Wholesale Consolidation Loans for the year ended December 31, 2007), other com-
mitment clients, and subsidiary acquisitions.
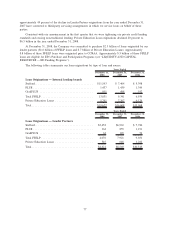
Premiums paid as a percentage of principal balance for both internal lending brands and lender partner
volume can be impacted by Front-End Borrower Benefits where we pay the origination fee and/or federal
guaranty fee on behalf of borrowers. Historically, this offered benefit had the impact of increasing the effective
premium rate on the loan volume over time as this benefit was offered to a larger segment of our loan
originations. During the first half of 2008, the Company suspended participation in the federal consolidation
loan program and also discontinued subsidizing on behalf of borrowers the federally mandated Stafford loan
origination fee for loans guaranteed after May 2, 2008. As a result, we expect and have seen our premiums
decline on this volume in 2008. Declines in lender partner premiums will lag those of internal lending brands
since acquisitions of lender partner volume may relate to loans originated in prior periods when the Front-End
Borrower Benefits were still being offered.
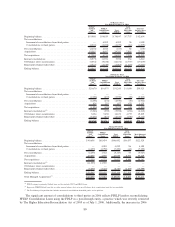
Included in “consolidation originations” is the 0.5 percent FFELP Consolidation Loan origination fee paid
on the total balance of new FFELP Consolidation Loans made prior to October 1, 2007 (and 1.0 percent for
FFELP Consolidation Loans made after October 1, 2007), including internally consolidated loans from our
existing portfolio. The “consolidation originations” premium paid percentage is calculated on only consolida-
tion volume that is incremental to our portfolio. This percentage is largely driven by the mix of internal
consolidations. As previously discussed, the Company suspended participation in the federal consolidation loan
program in April 2008.
74