Sallie Mae 2008 Annual Report Download - page 35
Download and view the complete annual report
Please find page 35 of the 2008 Sallie Mae annual report below. You can navigate through the pages in the report by either clicking on the pages listed below, or by using the keyword search tool below to find specific information within the annual report.-
 1
1 -
2
-
3
-
4
-
5
-
6
-
7
-
8
-
9
-
10
-
11
-
12
-
13
-
14
-
15
-
16
-
17
-
18
-
19
-
20
-
21
-
22
-
23
-
24
-
 25
25 -
 26
26 -
 27
27 -
 28
28 -
 29
29 -
 30
30 -
 31
31 -
 32
32 -
 33
33 -
 34
34 -
 35
35 -
 36
36 -
 37
37 -
 38
38 -
 39
39 -
 40
40 -
 41
41 -
 42
42 -
 43
43 -
 44
44 -
 45
45 -
46
-
47
-
48
-
49
-
50
-
51
-
52
-
53
-
54
-
55
-
56
-
57
-
58
-
59
-
60
-
61
-
62
-
63
-
64
-
65
-
66
-
67
-
68
-
69
-
70
-
71
-
72
-
73
-
74
-
75
-
76
-
77
-
78
-
79
-
80
-
81
-
82
-
83
-
84
-
85
-
86
-
87
-
88
-
89
-
90
-
91
-
92
-
93
-
94
-
95
-
96
-
97
-
98
-
99
-
100
-
101
-
102
-
103
-
104
-
105
-
106
-
107
-
108
-
109
-
110
-
111
-
112
-
113
-
114
-
115
-
116
-
117
-
118
-
119
-
120
-
121
-
122
-
123
-
124
-
125
-
126
-
127
-
128
-
129
-
130
-
131
-
132
-
133
-
134
-
135
-
136
-
137
-
138
-
139
-
140
-
141
-
142
-
143
-
144
-
145
-
146
-
147
-
148
-
149
-
150
-
151
-
152
-
153
-
154
-
155
-
156
-
157
-
158
-
159
-
160
-
161
-
162
-
163
-
164
-
165
-
166
-
167
-
168
-
169
-
170
-
171
-
172
-
173
-
174
-
175
-
176
-
177
-
178
-
179
-
180
-
181
-
182
-
183
-
184
-
185
-
186
-
187
-
188
-
189
-
190
-
191
-
192
-
193
-
194
-
195
-
196
-
197
-
198
-
199
-
200
-
201
-
202
-
203
-
204
-
205
-
206
-
207
-
208
-
209
-
210
-
211
-
212
-
213
-
214
-
215
-
216
-
217
-
218
-
219
-
220
-
221
-
222
-
223
-
224
-
225
-
226
-
227
-
228
-
229
-
230
-
231
-
232
-
233
-
234
-
235
-
236
-
237
-
238
-
239
-
240
 |
 |

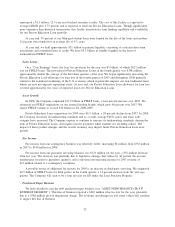
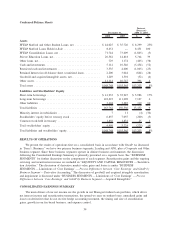
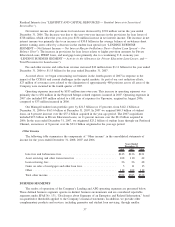
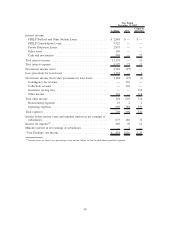
Condensed Balance Sheets
2008 2007 $ %
December 31,
Increase
(Decrease)
2008 vs. 2007
Assets
FFELP Stafford and Other Student Loans, net ................ $ 44,025 $ 35,726 $ 8,299 23%
FFELP Stafford Loans Held-for-Sale ....................... 8,451 — 8,451 100
FFELP Consolidation Loans, net .......................... 71,744 73,609 (1,865) (3)
Private Education Loans, net ............................. 20,582 14,818 5,764 39
Other loans, net ....................................... 729 1,174 (445) (38)
Cash and investments................................... 5,112 10,546 (5,434) (52)
Restricted cash and investments ........................... 3,535 4,600 (1,065) (23)
Retained Interest in off-balance sheet securitized loans .......... 2,200 3,044 (844) (28)
Goodwill and acquired intangible assets, net .................. 1,249 1,301 (52) (4)
Other assets.......................................... 11,141 10,747 394 4
Total assets .......................................... $168,768 $155,565 $13,203 8%
Liabilities and Stockholders’ Equity
Short-term borrowings .................................. $ 41,933 $ 35,947 $ 5,986 17%
Long-term borrowings .................................. 118,225 111,098 7,127 6
Other liabilities ....................................... 3,604 3,285 319 10
Total liabilities ....................................... 163,762 150,330 13,432 9
Minority interest in subsidiaries ........................... 7 11 (4) (36)
Stockholders’ equity before treasury stock ................... 6,855 7,055 (200) (3)
Common stock held in treasury ........................... 1,856 1,831 25 1
Total stockholders’ equity ............................... 4,999 5,224 (225) (4)
Total liabilities and stockholders’ equity ..................... $168,768 $155,565 $13,203 8%
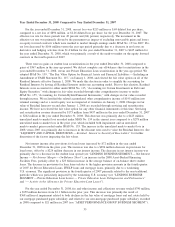
RESULTS OF OPERATIONS
We present the results of operations first on a consolidated basis in accordance with GAAP. As discussed
in “Item 1. Business,” we have two primary business segments, Lending and APG, plus a Corporate and Other
business segment. Since these business segments operate in distinct business environments, the discussion
following the Consolidated Earnings Summary is primarily presented on a segment basis. See “BUSINESS
SEGMENTS” for further discussion on the components of each segment. Securitization gains and the ongoing
servicing and securitization income are included in “LIQUIDITY AND CAPITAL RESOURCES — Securitiza-
tion Activities.” The discussion of derivative market value gains and losses is under “BUSINESS
SEGMENTS — Limitations of ‘Core Earnings’ — Pre-tax Differences between ‘Core Earnings’ and GAAP by
Business Segment — Derivative Accounting.” The discussion of goodwill and acquired intangible amortization
and impairment is discussed under “BUSINESS SEGMENTS — Limitations of ‘Core Earnings’ — Pre-tax
Differences between ‘Core Earnings’ and GAAP by Business Segment — Acquired Intangibles.”
CONSOLIDATED EARNINGS SUMMARY
The main drivers of our net income are the growth in our Managed student loan portfolio, which drives
net interest income and securitization transactions, the spread we earn on student loans, unrealized gains and
losses on derivatives that do not receive hedge accounting treatment, the timing and size of securitization
gains, growth in our fee-based business, and expense control.
34