Sallie Mae 2008 Annual Report Download - page 149
Download and view the complete annual report
Please find page 149 of the 2008 Sallie Mae annual report below. You can navigate through the pages in the report by either clicking on the pages listed below, or by using the keyword search tool below to find specific information within the annual report.-
 1
1 -
2
-
3
-
4
-
5
-
6
-
7
-
8
-
9
-
10
-
11
-
12
-
13
-
14
-
15
-
16
-
17
-
18
-
19
-
20
-
21
-
22
-
23
-
24
-
25
-
26
-
27
-
28
-
29
-
30
-
31
-
32
-
33
-
34
-
35
-
36
-
37
-
38
-
39
-
40
-
41
-
42
-
43
-
44
-
45
-
46
-
47
-
48
-
49
-
50
-
51
-
52
-
53
-
54
-
55
-
56
-
57
-
58
-
59
-
60
-
61
-
62
-
63
-
64
-
65
-
66
-
67
-
68
-
69
-
70
-
71
-
72
-
73
-
74
-
75
-
76
-
77
-
78
-
79
-
80
-
81
-
82
-
83
-
84
-
85
-
86
-
87
-
88
-
89
-
90
-
91
-
92
-
93
-
94
-
95
-
96
-
97
-
98
-
99
-
100
-
101
-
102
-
103
-
104
-
105
-
106
-
107
-
108
-
109
-
110
-
111
-
112
-
113
-
114
-
115
-
116
-
117
-
118
-
119
-
120
-
121
-
122
-
123
-
124
-
125
-
126
-
127
-
128
-
129
-
130
-
131
-
132
-
133
-
134
-
135
-
136
-
137
-
138
-
 139
139 -
 140
140 -
 141
141 -
 142
142 -
 143
143 -
 144
144 -
 145
145 -
 146
146 -
 147
147 -
 148
148 -
 149
149 -
 150
150 -
 151
151 -
 152
152 -
 153
153 -
 154
154 -
 155
155 -
 156
156 -
 157
157 -
 158
158 -
 159
159 -
160
-
161
-
162
-
163
-
164
-
165
-
166
-
167
-
168
-
169
-
170
-
171
-
172
-
173
-
174
-
175
-
176
-
177
-
178
-
179
-
180
-
181
-
182
-
183
-
184
-
185
-
186
-
187
-
188
-
189
-
190
-
191
-
192
-
193
-
194
-
195
-
196
-
197
-
198
-
199
-
200
-
201
-
202
-
203
-
204
-
205
-
206
-
207
-
208
-
209
-
210
-
211
-
212
-
213
-
214
-
215
-
216
-
217
-
218
-
219
-
220
-
221
-
222
-
223
-
224
-
225
-
226
-
227
-
228
-
229
-
230
-
231
-
232
-
233
-
234
-
235
-
236
-
237
-
238
-
239
-
240
 |
 |

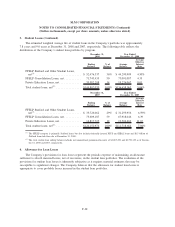
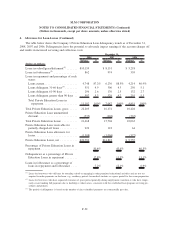
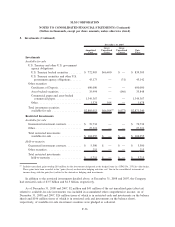
4. Allowance for Loan Losses (Continued)
The following tables summarize the total loan loss provisions for the years ended December 31, 2008,
2007 and 2006.
2008 2007 2006
Years Ended December 31,
Private Education Loans ............................ $586,169 $ 883,474 $257,983
FFELP Stafford and Other Student Loans ............... 105,568 89,083 13,907
Mortgage and consumer loans ........................ 27,913 42,751 15,072
Total provisions for loan losses ....................... $719,650 $1,015,308 $286,962
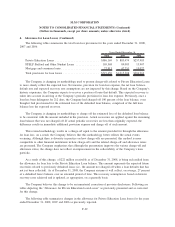
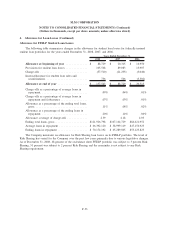
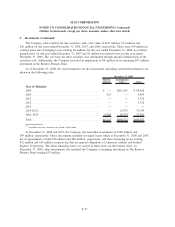
The Company is changing its methodology used to present charge-offs related to Private Education Loans
to more clearly reflect the expected loss. Net income, provision for loan loss expense, the net loan balance,
default rate and expected recovery rate assumptions are not impacted by this change. Based on the Company’s
historic experience, the Company expects to recover a portion of loans that default. This expected recovery is
taken into account in arriving at the Company’s periodic provision for loan loss expense. Previously, once a
loan has been delinquent for 212 days, the Company had charged off 100 percent of the loan balance, even
though it had provisioned for the estimated loss of the defaulted loan balance, comprised of the full loan
balance less the expected recovery.
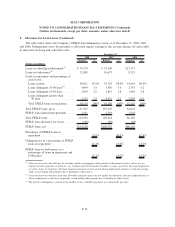
The Company is changing its methodology to charge off the estimated loss of the defaulted loan balance
to be consistent with the amount included in the provision. Actual recoveries are applied against the remaining
loan balance that was not charged off. If actual periodic recoveries are less than originally expected, the
difference results in immediate additional provision expense and charge off of such amount.
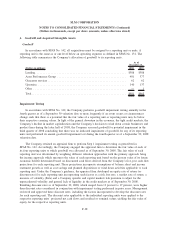
This revised methodology results in a charge-off equal to the amount provided for through the allowance
for loan loss. As a result, the Company believes that this methodology better reflects the actual events
occurring. Although there is diversity in practice on how charge-offs are presented, this method is more
comparable to other financial institutions in how charge-offs and the related charge-off and allowance ratios
are presented. The Company emphasizes that although the presentation improves the various charge-off and
allowance ratios, the change does not reflect an improvement in the collectability of the Company’s loan
portfolio.
As a result of this change, a $222 million receivable as of December 31, 2008, is being reclassified from
the allowance for loan loss to the Private Education Loan balance. This amount represents the expected future
recoveries related to previously defaulted loans (i.e., the amount not charged off when a loan defaults that has
not yet been collected). As of December 31, 2008, the Company assumes it will collect, on average, 27 percent
of a defaulted loan’s balance over an extended period of time. This recovery assumption is based on historic
recovery rates achieved and is updated, as appropriate, on a quarterly basis.
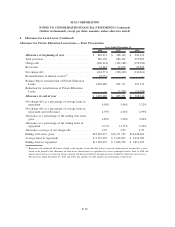
The Company believes this change to be an immaterial correction of previous disclosures. Following are
tables depicting the “Allowance for Private Education Loan Losses” as previously presented and as corrected
for this change.
The following table summarizes changes in the allowance for Private Education Loan losses for the years
ended December 31, 2008, 2007 and 2006 as previously reported.
F-29
SLM CORPORATION
NOTES TO CONSOLIDATED FINANCIAL STATEMENTS (Continued)
(Dollars in thousands, except per share amounts, unless otherwise stated)