Sallie Mae 2008 Annual Report Download - page 96
Download and view the complete annual report
Please find page 96 of the 2008 Sallie Mae annual report below. You can navigate through the pages in the report by either clicking on the pages listed below, or by using the keyword search tool below to find specific information within the annual report.-
 1
1 -
2
-
3
-
4
-
5
-
6
-
7
-
8
-
9
-
10
-
11
-
12
-
13
-
14
-
15
-
16
-
17
-
18
-
19
-
20
-
21
-
22
-
23
-
24
-
25
-
26
-
27
-
28
-
29
-
30
-
31
-
32
-
33
-
34
-
35
-
36
-
37
-
38
-
39
-
40
-
41
-
42
-
43
-
44
-
45
-
46
-
47
-
48
-
49
-
50
-
51
-
52
-
53
-
54
-
55
-
56
-
57
-
58
-
59
-
60
-
61
-
62
-
63
-
64
-
65
-
66
-
67
-
68
-
69
-
70
-
71
-
72
-
73
-
74
-
75
-
76
-
77
-
78
-
79
-
80
-
81
-
82
-
83
-
84
-
85
-
 86
86 -
 87
87 -
 88
88 -
 89
89 -
 90
90 -
 91
91 -
 92
92 -
 93
93 -
 94
94 -
 95
95 -
 96
96 -
 97
97 -
 98
98 -
 99
99 -
 100
100 -
 101
101 -
 102
102 -
 103
103 -
 104
104 -
 105
105 -
 106
106 -
107
-
108
-
109
-
110
-
111
-
112
-
113
-
114
-
115
-
116
-
117
-
118
-
119
-
120
-
121
-
122
-
123
-
124
-
125
-
126
-
127
-
128
-
129
-
130
-
131
-
132
-
133
-
134
-
135
-
136
-
137
-
138
-
139
-
140
-
141
-
142
-
143
-
144
-
145
-
146
-
147
-
148
-
149
-
150
-
151
-
152
-
153
-
154
-
155
-
156
-
157
-
158
-
159
-
160
-
161
-
162
-
163
-
164
-
165
-
166
-
167
-
168
-
169
-
170
-
171
-
172
-
173
-
174
-
175
-
176
-
177
-
178
-
179
-
180
-
181
-
182
-
183
-
184
-
185
-
186
-
187
-
188
-
189
-
190
-
191
-
192
-
193
-
194
-
195
-
196
-
197
-
198
-
199
-
200
-
201
-
202
-
203
-
204
-
205
-
206
-
207
-
208
-
209
-
210
-
211
-
212
-
213
-
214
-
215
-
216
-
217
-
218
-
219
-
220
-
221
-
222
-
223
-
224
-
225
-
226
-
227
-
228
-
229
-
230
-
231
-
232
-
233
-
234
-
235
-
236
-
237
-
238
-
239
-
240
 |
 |

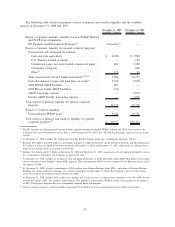
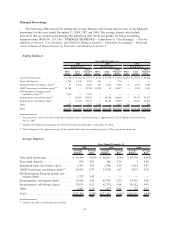
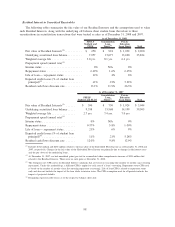
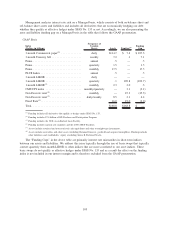
Managed Borrowings
The following tables present the ending and average balances and average interest rates of our Managed
borrowings for the years ended December 31, 2008, 2007 and 2006. The average interest rates include
derivatives that are economically hedging the underlying debt but do not qualify for hedge accounting
treatment under SFAS No. 133. (See “BUSINESS SEGMENTS — Limitations of ‘Core Earnings’ — Pre-tax
Differences between ‘Core Earnings’ and GAAP by Business Segment — Derivative Accounting — Reclassifi-
cation of Realized Gains (Losses) on Derivative and Hedging Activities.”)
Ending Balances
Short
Term
Long
Term
Total
Managed
Basis
Short
Term
Long
Term
Total
Managed
Basis
Short
Term
Long
Term
Total
Managed
Basis
Ending Balance Ending Balance Ending Balance
2008 2007 2006
Years Ended December 31,
Unsecured borrowings . .............. $ 6,794 $ 31,182 $ 37,976 $ 8,297 $ 36,796 $ 45,093 $3,187 $ 45,501 $ 48,688
Term bank deposits . . . .............. 1,148 1,108 2,256 254 — 254 — — —
Indentured trusts (on-balance sheet)
(1)
..... 31 1,972 2,003 100 2,481 2,581 93 2,852 2,945
ABCP borrowings (on-balance sheet)
(1)(2)
. . 24,768 — 24,768 25,960 67 26,027 — 4,953 4,953
ED Participation Program facility
(on-balance sheet)
(1)(3)
............. 7,365 — 7,365 — — — — — —
Securitizations (on-balance sheet)
(1)
...... — 80,601 80,601 — 68,048 68,048 — 50,147 50,147
Securitizations (off-balance sheet) . . . .... — 37,159 37,159 — 42,088 42,088 — 49,865 49,865
Other . . ........................ 1,827 — 1,827 1,342 — 1,342 248 — 248
Total . . ........................ $41,933 $152,022 $193,955 $35,953 $149,480 $185,433 $3,528 $153,318 $156,846
(1)
The book basis of the assets that secure the on-balance sheet secured financings is approximately $128.8 billion in total at Decem-
ber 31, 2008.
(2)
Includes $1.9 billion outstanding in the 2008 Asset-Backed Loan Facility at December 31, 2008.
(3)
The Company has the option of paying off this amount with cash or by putting the loans to ED as previously discussed.
Average Balances
Average
Balance
Average
Rate
Average
Balance
Average
Rate
Average
Balance
Average
Rate
2008 2007 2006
Years Ended December 31,
Unsecured borrowings ............... $ 39,794 3.65% $ 46,095 5.58% $ 43,754 5.50%
Term bank deposits ................. 854 4.07 166 5.26 1 4.98
Indentured trusts (on-balance sheet) ..... 2,363 3.90 2,768 4.90 3,252 4.57
ABCP borrowings (on-balance sheet)
(1)
. . . 24,855 5.27 13,938 5.85 4,874 5.36
ED Participation Program facility (on-
balance sheet) ................... 1,727 3.43 — — — —
Securitizations (on-balance sheet) ....... 76,028 3.26 62,765 5.55 43,310 5.40
Securitizations (off-balance sheet)....... 39,625 3.11 45,733 5.68 50,112 5.49
Other ............................ 2,063 2.35 637 4.85 172 5.03
Total ............................ $187,309 3.58% $172,102 5.60% $145,475 5.44%
(1)
Includes the 2008 Asset-Backed Loan Facility.
95