Sallie Mae 2008 Annual Report Download - page 48
Download and view the complete annual report
Please find page 48 of the 2008 Sallie Mae annual report below. You can navigate through the pages in the report by either clicking on the pages listed below, or by using the keyword search tool below to find specific information within the annual report.-
 1
1 -
2
-
3
-
4
-
5
-
6
-
7
-
8
-
9
-
10
-
11
-
12
-
13
-
14
-
15
-
16
-
17
-
18
-
19
-
20
-
21
-
22
-
23
-
24
-
25
-
26
-
27
-
28
-
29
-
30
-
31
-
32
-
33
-
34
-
35
-
36
-
37
-
 38
38 -
 39
39 -
 40
40 -
 41
41 -
 42
42 -
 43
43 -
 44
44 -
 45
45 -
 46
46 -
 47
47 -
 48
48 -
 49
49 -
 50
50 -
 51
51 -
 52
52 -
 53
53 -
 54
54 -
 55
55 -
 56
56 -
 57
57 -
 58
58 -
59
-
60
-
61
-
62
-
63
-
64
-
65
-
66
-
67
-
68
-
69
-
70
-
71
-
72
-
73
-
74
-
75
-
76
-
77
-
78
-
79
-
80
-
81
-
82
-
83
-
84
-
85
-
86
-
87
-
88
-
89
-
90
-
91
-
92
-
93
-
94
-
95
-
96
-
97
-
98
-
99
-
100
-
101
-
102
-
103
-
104
-
105
-
106
-
107
-
108
-
109
-
110
-
111
-
112
-
113
-
114
-
115
-
116
-
117
-
118
-
119
-
120
-
121
-
122
-
123
-
124
-
125
-
126
-
127
-
128
-
129
-
130
-
131
-
132
-
133
-
134
-
135
-
136
-
137
-
138
-
139
-
140
-
141
-
142
-
143
-
144
-
145
-
146
-
147
-
148
-
149
-
150
-
151
-
152
-
153
-
154
-
155
-
156
-
157
-
158
-
159
-
160
-
161
-
162
-
163
-
164
-
165
-
166
-
167
-
168
-
169
-
170
-
171
-
172
-
173
-
174
-
175
-
176
-
177
-
178
-
179
-
180
-
181
-
182
-
183
-
184
-
185
-
186
-
187
-
188
-
189
-
190
-
191
-
192
-
193
-
194
-
195
-
196
-
197
-
198
-
199
-
200
-
201
-
202
-
203
-
204
-
205
-
206
-
207
-
208
-
209
-
210
-
211
-
212
-
213
-
214
-
215
-
216
-
217
-
218
-
219
-
220
-
221
-
222
-
223
-
224
-
225
-
226
-
227
-
228
-
229
-
230
-
231
-
232
-
233
-
234
-
235
-
236
-
237
-
238
-
239
-
240
 |
 |

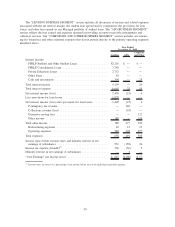
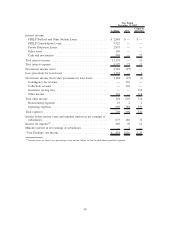
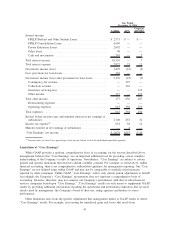
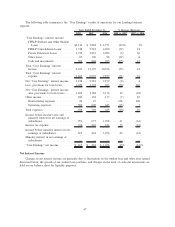
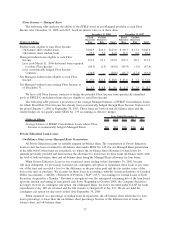
The following table summarizes the “Core Earnings” results of operations for our Lending business
segment.
2008 2007 2006 2008 vs. 2007 2007 vs. 2006
Years Ended December 31, % Increase (Decrease)
“Core Earnings” interest income:
FFELP Stafford and Other Student
Loans ..................... $2,216 $ 2,848 $ 2,771 (22)% 3%
FFELP Consolidation Loans ...... 3,748 5,522 4,690 (32) 18
Private Education Loans ......... 2,752 2,835 2,092 (3) 36
Other loans ................... 83 106 98 (22) 8
Cash and investments ........... 304 868 705 (65) 23
Total “Core Earnings” interest
income ...................... 9,103 12,179 10,356 (25) 18
Total “Core Earnings” interest
expense...................... 6,665 9,597 7,877 (31) 22
Net “Core Earnings” interest income . . 2,438 2,582 2,479 (6) 4
Less: provisions for loan losses ...... 1,029 1,394 303 (26) 360
Net “Core Earnings” interest income
after provisions for loan losses..... 1,409 1,188 2,176 19 (45)
Other income ................... 180 194 177 (7) 10
Restructuring expenses .......... 49 19 — 158 100
Operating expenses ............. 589 690 645 (15) 7
Total expenses .................. 638 709 645 (10) 10
Income before income taxes and
minority interest in net earnings of
subsidiaries ................... 951 673 1,708 41 (61)
Income tax expense............... 336 249 632 35 (61)
Income before minority interest in net
earnings of subsidiaries .......... 615 424 1,076 45 (61)
Minority interest in net earnings of
subsidiaries ................... — — — — —
“Core Earnings” net income ........ $ 615 $ 424 $ 1,076 45% (61)%
Net Interest Income
Changes in net interest income are primarily due to fluctuations in the student loan and other asset spread
discussed below, the growth of our student loan portfolio, and changes in the level of cash and investments we
hold on our balance sheet for liquidity purposes.
47