Sallie Mae 2008 Annual Report Download - page 43
Download and view the complete annual report
Please find page 43 of the 2008 Sallie Mae annual report below. You can navigate through the pages in the report by either clicking on the pages listed below, or by using the keyword search tool below to find specific information within the annual report.-
 1
1 -
2
-
3
-
4
-
5
-
6
-
7
-
8
-
9
-
10
-
11
-
12
-
13
-
14
-
15
-
16
-
17
-
18
-
19
-
20
-
21
-
22
-
23
-
24
-
25
-
26
-
27
-
28
-
29
-
30
-
31
-
32
-
 33
33 -
 34
34 -
 35
35 -
 36
36 -
 37
37 -
 38
38 -
 39
39 -
 40
40 -
 41
41 -
 42
42 -
 43
43 -
 44
44 -
 45
45 -
 46
46 -
 47
47 -
 48
48 -
 49
49 -
 50
50 -
 51
51 -
 52
52 -
 53
53 -
54
-
55
-
56
-
57
-
58
-
59
-
60
-
61
-
62
-
63
-
64
-
65
-
66
-
67
-
68
-
69
-
70
-
71
-
72
-
73
-
74
-
75
-
76
-
77
-
78
-
79
-
80
-
81
-
82
-
83
-
84
-
85
-
86
-
87
-
88
-
89
-
90
-
91
-
92
-
93
-
94
-
95
-
96
-
97
-
98
-
99
-
100
-
101
-
102
-
103
-
104
-
105
-
106
-
107
-
108
-
109
-
110
-
111
-
112
-
113
-
114
-
115
-
116
-
117
-
118
-
119
-
120
-
121
-
122
-
123
-
124
-
125
-
126
-
127
-
128
-
129
-
130
-
131
-
132
-
133
-
134
-
135
-
136
-
137
-
138
-
139
-
140
-
141
-
142
-
143
-
144
-
145
-
146
-
147
-
148
-
149
-
150
-
151
-
152
-
153
-
154
-
155
-
156
-
157
-
158
-
159
-
160
-
161
-
162
-
163
-
164
-
165
-
166
-
167
-
168
-
169
-
170
-
171
-
172
-
173
-
174
-
175
-
176
-
177
-
178
-
179
-
180
-
181
-
182
-
183
-
184
-
185
-
186
-
187
-
188
-
189
-
190
-
191
-
192
-
193
-
194
-
195
-
196
-
197
-
198
-
199
-
200
-
201
-
202
-
203
-
204
-
205
-
206
-
207
-
208
-
209
-
210
-
211
-
212
-
213
-
214
-
215
-
216
-
217
-
218
-
219
-
220
-
221
-
222
-
223
-
224
-
225
-
226
-
227
-
228
-
229
-
230
-
231
-
232
-
233
-
234
-
235
-
236
-
237
-
238
-
239
-
240
 |
 |

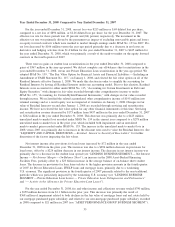
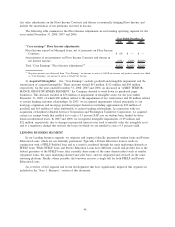
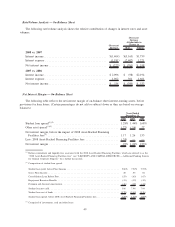
SFAS No. 133, “Accounting for Derivative Instruments and Hedging Activities,” on derivatives that do not
qualify for “hedge treatment,” as well as on derivatives that do qualify but are in part ineffective because they
are not perfect hedges, we focus on the long-term economic effectiveness of those instruments relative to the
underlying hedged item and isolate the effects of interest rate volatility, changing credit spreads and changes
in our stock price on the fair value of such instruments during the period. Under GAAP, the effects of these
factors on the fair value of the derivative instruments (but not on the underlying hedged item) tend to show
more volatility in the short term. While our presentation of our results on a “Core Earnings” basis provides
important information regarding the performance of our Managed portfolio, a limitation of this presentation is
that we are presenting the ongoing spread income on loans that have been sold to a trust managed by us.
While we believe that our “Core Earnings” presentation presents the economic substance of our Managed loan
portfolio, it understates earnings volatility from securitization gains. Our “Core Earnings” results exclude
certain Floor Income, which is real cash income, from our reported results and therefore may understate
earnings in certain periods. Management’s financial planning and valuation of operating results, however, does
not take into account Floor Income because of its inherent uncertainty, except when it is economically hedged
through Floor Income Contracts.
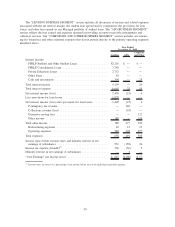
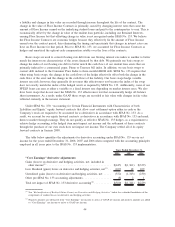
Pre-tax Differences between “Core Earnings” and GAAP by Business Segment
Our “Core Earnings” are the primary financial performance measures used by management to evaluate
performance and to allocate resources. Accordingly, financial information is reported to management on a
“Core Earnings” basis by reportable segment, as these are the measures used regularly by our chief operating
decision makers. Our “Core Earnings” are used in developing our financial plans and tracking results, and also
in establishing corporate performance targets and incentive compensation. Management believes this informa-
tion provides additional insight into the financial performance of the Company’s core business activities. “Core
Earnings” net income reflects only current period adjustments to GAAP net income, as described in the more
detailed discussion of the differences between “Core Earnings” and GAAP that follows, which includes further
detail on each specific adjustment required to reconcile our “Core Earnings” segment presentation to our
GAAP earnings.
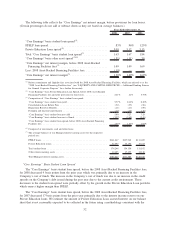
Lending APG
Corporate
and Other Lending APG
Corporate
and Other Lending APG
Corporate
and Other
2008 2007 2006
Years Ended December 31,
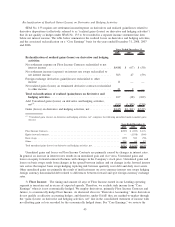
“Core Earnings” adjustments:
Net impact of securitization
accounting ................... $ (442) $ — $ — $ 247 $ — $ — $ 532 $ — $ —
Net impact of derivative accounting . . (560) — — 217 — (1,558) 131 — (360)
Net impact of Floor Income ........ (102) — — (169) — — (209) — —
Net impact of acquired intangibles . . . (53) (24) (14) (55) (28) (29) (49) (34) (11)
Total “Core Earnings” adjustments to
GAAP ...................... $(1,157) $(24) $(14) $ 240 $(28) $(1,587) $ 405 $(34) $(371)
1) Securitization Accounting: Under GAAP, certain securitization transactions in our Lending operat-
ing segment are accounted for as sales of assets. Under “Core Earnings” for the Lending operating segment,
we present all securitization transactions on a “Core Earnings” basis as long-term non-recourse financings.
The upfront “gains” on sale from securitization transactions, as well as ongoing “servicing and securitization
revenue” presented in accordance with GAAP, are excluded from “Core Earnings” and are replaced by interest
income, provisions for loan losses, and interest expense as earned or incurred on the securitization loans. We
also exclude transactions with our off-balance sheet trusts from “Core Earnings” as they are considered
intercompany transactions on a “Core Earnings” basis.
42