Sallie Mae 2008 Annual Report Download - page 40
Download and view the complete annual report
Please find page 40 of the 2008 Sallie Mae annual report below. You can navigate through the pages in the report by either clicking on the pages listed below, or by using the keyword search tool below to find specific information within the annual report.-
 1
1 -
2
-
3
-
4
-
5
-
6
-
7
-
8
-
9
-
10
-
11
-
12
-
13
-
14
-
15
-
16
-
17
-
18
-
19
-
20
-
21
-
22
-
23
-
24
-
25
-
26
-
27
-
28
-
29
-
 30
30 -
 31
31 -
 32
32 -
 33
33 -
 34
34 -
 35
35 -
 36
36 -
 37
37 -
 38
38 -
 39
39 -
 40
40 -
 41
41 -
 42
42 -
 43
43 -
 44
44 -
 45
45 -
 46
46 -
 47
47 -
 48
48 -
 49
49 -
 50
50 -
51
-
52
-
53
-
54
-
55
-
56
-
57
-
58
-
59
-
60
-
61
-
62
-
63
-
64
-
65
-
66
-
67
-
68
-
69
-
70
-
71
-
72
-
73
-
74
-
75
-
76
-
77
-
78
-
79
-
80
-
81
-
82
-
83
-
84
-
85
-
86
-
87
-
88
-
89
-
90
-
91
-
92
-
93
-
94
-
95
-
96
-
97
-
98
-
99
-
100
-
101
-
102
-
103
-
104
-
105
-
106
-
107
-
108
-
109
-
110
-
111
-
112
-
113
-
114
-
115
-
116
-
117
-
118
-
119
-
120
-
121
-
122
-
123
-
124
-
125
-
126
-
127
-
128
-
129
-
130
-
131
-
132
-
133
-
134
-
135
-
136
-
137
-
138
-
139
-
140
-
141
-
142
-
143
-
144
-
145
-
146
-
147
-
148
-
149
-
150
-
151
-
152
-
153
-
154
-
155
-
156
-
157
-
158
-
159
-
160
-
161
-
162
-
163
-
164
-
165
-
166
-
167
-
168
-
169
-
170
-
171
-
172
-
173
-
174
-
175
-
176
-
177
-
178
-
179
-
180
-
181
-
182
-
183
-
184
-
185
-
186
-
187
-
188
-
189
-
190
-
191
-
192
-
193
-
194
-
195
-
196
-
197
-
198
-
199
-
200
-
201
-
202
-
203
-
204
-
205
-
206
-
207
-
208
-
209
-
210
-
211
-
212
-
213
-
214
-
215
-
216
-
217
-
218
-
219
-
220
-
221
-
222
-
223
-
224
-
225
-
226
-
227
-
228
-
229
-
230
-
231
-
232
-
233
-
234
-
235
-
236
-
237
-
238
-
239
-
240
 |
 |

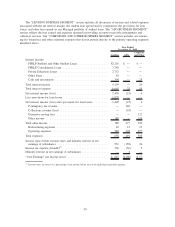
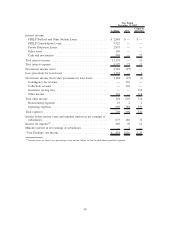
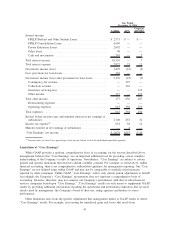
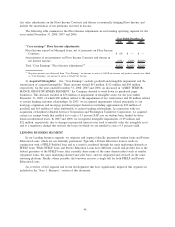
The “LENDING BUSINESS SEGMENT” section includes all discussion of income and related expenses
associated with the net interest margin, the student loan spread and its components, the provisions for loan
losses, and other fees earned on our Managed portfolio of student loans. The “APG BUSINESS SEGMENT”
section reflects the fees earned and expenses incurred in providing accounts receivable management and
collection services. Our “CORPORATE AND OTHER BUSINESS SEGMENT” section includes our remain-
ing fee businesses and other corporate expenses that do not pertain directly to the primary operating segments
identified above.
Lending APG
Corporate
and Other
Year Ended
December 31, 2008
Interest income:
FFELP Stafford and Other Student Loans .................... $2,216 $ — $ —
FFELP Consolidation Loans ............................. 3,748 — —
Private Education Loans ................................ 2,752 — —
Other loans .......................................... 83 — —
Cash and investments .................................. 304 — 25
Total interest income . . . .................................. 9,103 — 25
Total interest expense . . .................................. 6,665 25 19
Net interest income (loss) ................................. 2,438 (25) 6
Less: provisions for loan losses ............................. 1,029 — —
Net interest income (loss) after provisions for loan losses .......... 1,409 (25) 6
Contingency fee revenue ................................ — 340 —
Collections revenue (loss) ............................... — (63) —
Guarantor serving fees .................................. — — 121
Other income ........................................ 180 — 199
Total other income ...................................... 180 277 320
Restructuring expenses ................................. 49 12 23
Operating expenses . . .................................. 589 398 277
Total expenses.......................................... 638 410 300
Income (loss) before income taxes and minority interest in net
earnings of subsidiaries ................................. 951 (158) 26
Income tax expense (benefit)
(1)
............................. 336 (56) 9
Minority interest in net earnings of subsidiaries ................. — 4 —
“Core Earnings” net income (loss) ........................... $ 615 $(106) $ 17
(1)
Income taxes are based on a percentage of net income before tax for the individual reportable segment.
39