Sallie Mae 2008 Annual Report Download - page 176
Download and view the complete annual report
Please find page 176 of the 2008 Sallie Mae annual report below. You can navigate through the pages in the report by either clicking on the pages listed below, or by using the keyword search tool below to find specific information within the annual report.-
 1
1 -
2
-
3
-
4
-
5
-
6
-
7
-
8
-
9
-
10
-
11
-
12
-
13
-
14
-
15
-
16
-
17
-
18
-
19
-
20
-
21
-
22
-
23
-
24
-
25
-
26
-
27
-
28
-
29
-
30
-
31
-
32
-
33
-
34
-
35
-
36
-
37
-
38
-
39
-
40
-
41
-
42
-
43
-
44
-
45
-
46
-
47
-
48
-
49
-
50
-
51
-
52
-
53
-
54
-
55
-
56
-
57
-
58
-
59
-
60
-
61
-
62
-
63
-
64
-
65
-
66
-
67
-
68
-
69
-
70
-
71
-
72
-
73
-
74
-
75
-
76
-
77
-
78
-
79
-
80
-
81
-
82
-
83
-
84
-
85
-
86
-
87
-
88
-
89
-
90
-
91
-
92
-
93
-
94
-
95
-
96
-
97
-
98
-
99
-
100
-
101
-
102
-
103
-
104
-
105
-
106
-
107
-
108
-
109
-
110
-
111
-
112
-
113
-
114
-
115
-
116
-
117
-
118
-
119
-
120
-
121
-
122
-
123
-
124
-
125
-
126
-
127
-
128
-
129
-
130
-
131
-
132
-
133
-
134
-
135
-
136
-
137
-
138
-
139
-
140
-
141
-
142
-
143
-
144
-
145
-
146
-
147
-
148
-
149
-
150
-
151
-
152
-
153
-
154
-
155
-
156
-
157
-
158
-
159
-
160
-
161
-
162
-
163
-
164
-
165
-
 166
166 -
 167
167 -
 168
168 -
 169
169 -
 170
170 -
 171
171 -
 172
172 -
 173
173 -
 174
174 -
 175
175 -
 176
176 -
 177
177 -
 178
178 -
 179
179 -
 180
180 -
 181
181 -
 182
182 -
 183
183 -
 184
184 -
 185
185 -
 186
186 -
187
-
188
-
189
-
190
-
191
-
192
-
193
-
194
-
195
-
196
-
197
-
198
-
199
-
200
-
201
-
202
-
203
-
204
-
205
-
206
-
207
-
208
-
209
-
210
-
211
-
212
-
213
-
214
-
215
-
216
-
217
-
218
-
219
-
220
-
221
-
222
-
223
-
224
-
225
-
226
-
227
-
228
-
229
-
230
-
231
-
232
-
233
-
234
-
235
-
236
-
237
-
238
-
239
-
240
 |
 |

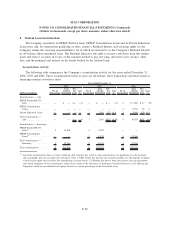
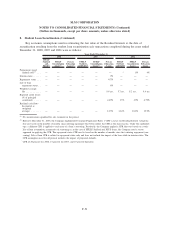
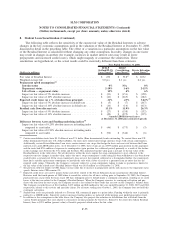
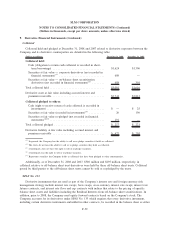
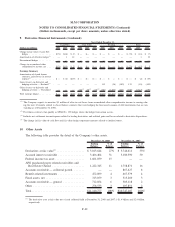
8. Student Loan Securitization (Continued)
The table below shows the Company’s off-balance sheet Private Education Loan delinquency trends as of
December 31, 2008 and 2007.
(Dollars in millions) Balance % Balance %
December 31,
2008
December 31,
2007
Off-Balance Sheet Private Education Loan
Delinquencies
Loans in-school/grace/deferment
(1)
..................... $ 3,461 $ 4,963
Loans in forbearance
(2)
.............................. 700 1,417
Loans in repayment and percentage of each status:
Loans current ................................... 8,843 92.8% 7,403 94.7%
Loans delinquent 31-60 days
(3)
...................... 315 3.3 202 2.6
Loans delinquent 61-90 days ........................ 121 1.3 84 1.1
Loans delinquent greater than 90 days ................. 251 2.6 130 1.6
Total off-balance sheet Private Education Loans in
repayment .................................... 9,530 100% 7,819 100%
Total off-balance sheet Private Education Loans, gross ....... $13,691 $14,199
(1)
Loans for borrowers who still may be attending school or engaging in other permitted educational activities and are not yet
required to make payments on the loans, e.g., residency periods for medical students or a grace period for bar exam preparation.
(2)
Loans for borrowers who have requested extension of grace period generally during employment transition or who have tempo-
rarily ceased making full payments due to hardship or other factors, consistent with the established loan program servicing poli-
cies and procedures.
(3)
The period of delinquency is based on the number of days scheduled payments are contractually past due.
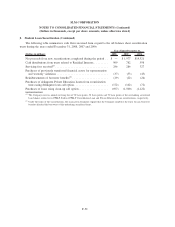
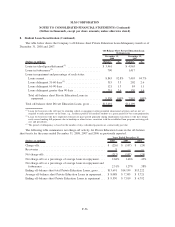
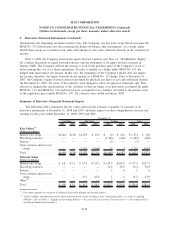
The following table summarizes net charge-off activity for Private Education Loans in the off-balance
sheet trusts for the years ended December 31, 2008, 2007 and 2006 as previously reported.
(Dollars in millions) 2008 2007 2006
Years Ended December 31,
Charge-offs .......................................... $ (226) $ (107) $ (24)
Recoveries .......................................... 9 — —
Net charge-offs . . . .................................... (217) (107) (24)
Net charge-offs as a percentage of average loans in repayment .... 2.68% 1.46% .43%
Net charge-offs as a percentage of average loans in repayment and
forbearance ........................................ 2.31% 1.27% .38%
Ending off-balance sheet total Private Education Loans, gross..... $13,691 $14,199 $13,222
Average off-balance sheet Private Education Loans in repayment . . $ 8,088 $ 7,305 $ 5,721
Ending off-balance sheet Private Education Loans in repayment . . . $ 9,530 $ 7,819 $ 6,792
F-56
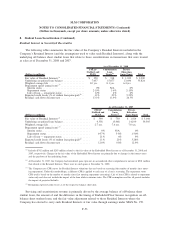
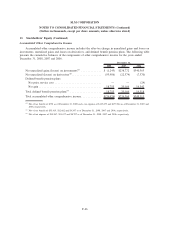
SLM CORPORATION
NOTES TO CONSOLIDATED FINANCIAL STATEMENTS (Continued)
(Dollars in thousands, except per share amounts, unless otherwise stated)