Sallie Mae 2008 Annual Report Download - page 80
Download and view the complete annual report
Please find page 80 of the 2008 Sallie Mae annual report below. You can navigate through the pages in the report by either clicking on the pages listed below, or by using the keyword search tool below to find specific information within the annual report.-
 1
1 -
2
-
3
-
4
-
5
-
6
-
7
-
8
-
9
-
10
-
11
-
12
-
13
-
14
-
15
-
16
-
17
-
18
-
19
-
20
-
21
-
22
-
23
-
24
-
25
-
26
-
27
-
28
-
29
-
30
-
31
-
32
-
33
-
34
-
35
-
36
-
37
-
38
-
39
-
40
-
41
-
42
-
43
-
44
-
45
-
46
-
47
-
48
-
49
-
50
-
51
-
52
-
53
-
54
-
55
-
56
-
57
-
58
-
59
-
60
-
61
-
62
-
63
-
64
-
65
-
66
-
67
-
68
-
69
-
 70
70 -
 71
71 -
 72
72 -
 73
73 -
 74
74 -
 75
75 -
 76
76 -
 77
77 -
 78
78 -
 79
79 -
 80
80 -
 81
81 -
 82
82 -
 83
83 -
 84
84 -
 85
85 -
 86
86 -
 87
87 -
 88
88 -
 89
89 -
 90
90 -
91
-
92
-
93
-
94
-
95
-
96
-
97
-
98
-
99
-
100
-
101
-
102
-
103
-
104
-
105
-
106
-
107
-
108
-
109
-
110
-
111
-
112
-
113
-
114
-
115
-
116
-
117
-
118
-
119
-
120
-
121
-
122
-
123
-
124
-
125
-
126
-
127
-
128
-
129
-
130
-
131
-
132
-
133
-
134
-
135
-
136
-
137
-
138
-
139
-
140
-
141
-
142
-
143
-
144
-
145
-
146
-
147
-
148
-
149
-
150
-
151
-
152
-
153
-
154
-
155
-
156
-
157
-
158
-
159
-
160
-
161
-
162
-
163
-
164
-
165
-
166
-
167
-
168
-
169
-
170
-
171
-
172
-
173
-
174
-
175
-
176
-
177
-
178
-
179
-
180
-
181
-
182
-
183
-
184
-
185
-
186
-
187
-
188
-
189
-
190
-
191
-
192
-
193
-
194
-
195
-
196
-
197
-
198
-
199
-
200
-
201
-
202
-
203
-
204
-
205
-
206
-
207
-
208
-
209
-
210
-
211
-
212
-
213
-
214
-
215
-
216
-
217
-
218
-
219
-
220
-
221
-
222
-
223
-
224
-
225
-
226
-
227
-
228
-
229
-
230
-
231
-
232
-
233
-
234
-
235
-
236
-
237
-
238
-
239
-
240
 |
 |

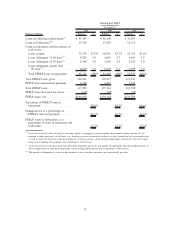
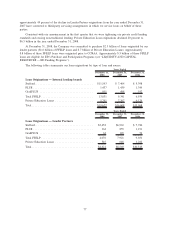
FFELP
Stafford
and
Other
(1)
FFELP
Consolidation
Loans
Total
FFELP
Total
Private
Education
Loans
Total On-
Balance Sheet
Portfolio
On-Balance Sheet
Year Ended December 31, 2007
Beginning balance ............................... $24,841 $61,324 $ 86,165 $ 9,755 $ 95,920
Net consolidations:
Incremental consolidations from third parties . ........... — 2,206 2,206 235 2,441
Consolidations to third parties ..................... (2,352) (801) (3,153) (45) (3,198)
Net consolidations ............................... (2,352) 1,405 (947) 190 (757)
Acquisitions ................................... 19,835 8,437 28,272 8,388 36,660
Net acquisitions . ............................... 17,483 9,842 27,325 8,578 35,903
Internal consolidations . . .......................... (4,413) 6,652 2,239 536 2,775
Off-balance sheet securitizations. ..................... — — — (1,871) (1,871)
Repayments/claims/resales/other . ..................... (2,185) (4,209) (6,394) (2,180) (8,574)
Ending balance . . ............................... $35,726 $73,609 $109,335 $14,818 $124,153
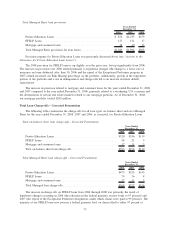
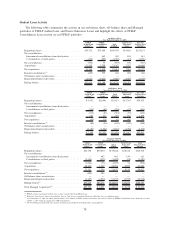
FFELP
Stafford
and
Other
(1)
FFELP
Consolidation
Loans
Total
FFELP
Total
Private
Education
Loans
Total Off-
Balance Sheet
Portfolio
Off-Balance Sheet
Year Ended December 31, 2007
Beginning balance . . ............................. $15,028 $18,311 $33,339 $12,833 $46,172
Net consolidations:
Incremental consolidations from third parties............. — — — — —
Consolidations to third parties . . . ................... (933) (207) (1,140) (93) (1,233)
Net consolidations . . ............................. (933) (207) (1,140) (93) (1,233)
Acquisitions . .................................. 330 209 539 704 1,243
Net acquisitions ................................. (603) 2 (601) 611 10
Internal consolidations
(2)
........................... (1,494) (745) (2,239) (536) (2,775)
Off-balance sheet securitizations . . . ................... — — — 1,871 1,871
Repayments/claims/resales/other . . . ................... (3,459) (1,127) (4,586) (1,269) (5,855)
Ending balance ................................. $ 9,472 $16,441 $25,913 $13,510 $39,423
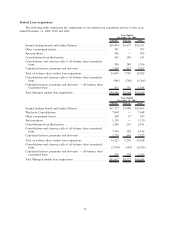
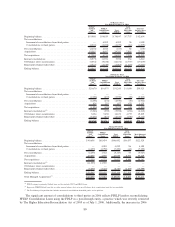
FFELP
Stafford
and
Other
(1)
FFELP
Consolidation
Loans
Total
FFELP
Total
Private
Education
Loans
Total
Managed
Basis Portfolio
Managed Portfolio
Year Ended December 31, 2007
Beginning balance . ............................. $39,869 $79,635 $119,504 $22,588 $142,092
Net consolidations:
Incremental consolidations from third parties . . ......... — 2,206 2,206 235 2,441
Consolidations to third parties . . ................... (3,285) (1,008) (4,293) (138) (4,431)
Net consolidations . ............................. (3,285) 1,198 (2,087) 97 (1,990)
Acquisitions .................................. 20,165 8,646 28,811 9,092 37,903
Net acquisitions . . . ............................. 16,880 9,844 26,724 9,189 35,913
Internal consolidations
(2)
.......................... (5,907) 5,907 — — —
Off-balance sheet securitizations . . ................... — — — — —
Repayments/claims/resales/other . . ................... (5,644) (5,336) (10,980) (3,449) (14,429)
Ending balance
(3)
............................... $45,198 $90,050 $135,248 $28,328 $163,576
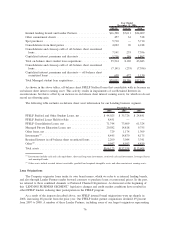
Total Managed Acquisitions
(4)
....................... $20,165 $10,852 $ 31,017 $ 9,327 $ 40,344
(1)
FFELP category is primarily Stafford loans and also includes PLUS and HEAL loans.
(2)
Represents loans that we either own on-balance sheet or loans that we consolidated from our off-balance sheet securitization trusts.
(3)
As of December 31, 2007, the ending balance includes $1.3 billion of FFELP Stafford and Other Loans and $1.4 billion of FFELP Consolidation Loans disbursed on or after
October 1, 2007, which are impacted by CCRAA legislation.
(4)
The Total Managed Acquisitions line includes incremental consolidations from third parties and acquisitions.
79