Sallie Mae 2008 Annual Report Download - page 69
Download and view the complete annual report
Please find page 69 of the 2008 Sallie Mae annual report below. You can navigate through the pages in the report by either clicking on the pages listed below, or by using the keyword search tool below to find specific information within the annual report.-
 1
1 -
2
-
3
-
4
-
5
-
6
-
7
-
8
-
9
-
10
-
11
-
12
-
13
-
14
-
15
-
16
-
17
-
18
-
19
-
20
-
21
-
22
-
23
-
24
-
25
-
26
-
27
-
28
-
29
-
30
-
31
-
32
-
33
-
34
-
35
-
36
-
37
-
38
-
39
-
40
-
41
-
42
-
43
-
44
-
45
-
46
-
47
-
48
-
49
-
50
-
51
-
52
-
53
-
54
-
55
-
56
-
57
-
58
-
 59
59 -
 60
60 -
 61
61 -
 62
62 -
 63
63 -
 64
64 -
 65
65 -
 66
66 -
 67
67 -
 68
68 -
 69
69 -
 70
70 -
 71
71 -
 72
72 -
 73
73 -
 74
74 -
 75
75 -
 76
76 -
 77
77 -
 78
78 -
 79
79 -
80
-
81
-
82
-
83
-
84
-
85
-
86
-
87
-
88
-
89
-
90
-
91
-
92
-
93
-
94
-
95
-
96
-
97
-
98
-
99
-
100
-
101
-
102
-
103
-
104
-
105
-
106
-
107
-
108
-
109
-
110
-
111
-
112
-
113
-
114
-
115
-
116
-
117
-
118
-
119
-
120
-
121
-
122
-
123
-
124
-
125
-
126
-
127
-
128
-
129
-
130
-
131
-
132
-
133
-
134
-
135
-
136
-
137
-
138
-
139
-
140
-
141
-
142
-
143
-
144
-
145
-
146
-
147
-
148
-
149
-
150
-
151
-
152
-
153
-
154
-
155
-
156
-
157
-
158
-
159
-
160
-
161
-
162
-
163
-
164
-
165
-
166
-
167
-
168
-
169
-
170
-
171
-
172
-
173
-
174
-
175
-
176
-
177
-
178
-
179
-
180
-
181
-
182
-
183
-
184
-
185
-
186
-
187
-
188
-
189
-
190
-
191
-
192
-
193
-
194
-
195
-
196
-
197
-
198
-
199
-
200
-
201
-
202
-
203
-
204
-
205
-
206
-
207
-
208
-
209
-
210
-
211
-
212
-
213
-
214
-
215
-
216
-
217
-
218
-
219
-
220
-
221
-
222
-
223
-
224
-
225
-
226
-
227
-
228
-
229
-
230
-
231
-
232
-
233
-
234
-
235
-
236
-
237
-
238
-
239
-
240
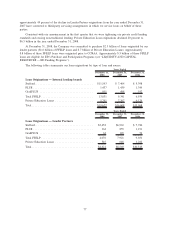
 |
 |

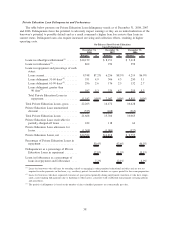
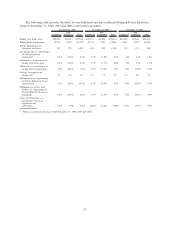
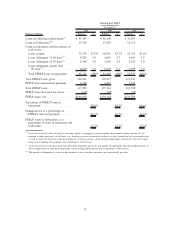
December 31, 2007 0 to 24 25 to 48 More than 48
Not Yet in
Repayment Total
Monthly Scheduled Payments Due
Loans in-school/grace/deferment ............. $ — $ — $ — $13,114 $13,114
Loans in forbearance ...................... 2,228 118 45 — 2,391
Loans in repayment — current ............... 9,184 2,807 1,648 — 13,639
Loans in repayment — delinquent 31-60 days .... 407 64 37 — 508
Loans in repayment — delinquent 61-90 days .... 221 25 14 — 260
Loans in repayment — delinquent greater than
90 days .............................. 376 52 31 — 459
Total .................................. $12,416 $3,066 $1,775 $13,114 30,371
Unamortized discount ..................... (823)
Receivable for partially charged-off loans ....... 146
Allowance for loan losses .................. (1,366)
Total Managed Private Education Loans, net .... $28,328
Loans in forbearance as a percentage of loans in
repayment and forbearance ................ 17.9% 3.8% 2.5% —% 13.9%
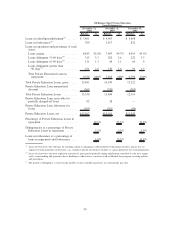
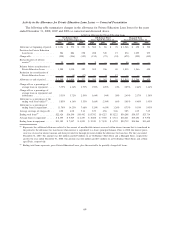
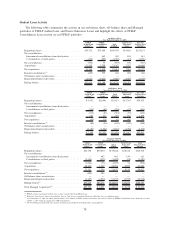
December 31, 2006 0 to 24 25 to 48 More than 48
Not Yet in
Repayment Total
Monthly Scheduled Payments Due
Loans in-school/grace/deferment .............. $ — $ — $ — $10,826 $10,826
Loans in forbearance ....................... 1,106 50 25 — 1,181
Loans in repayment — current ................ 7,181 2,151 1,301 — 10,633
Loans in repayment — delinquent 31-60 days..... 366 66 40 — 472
Loans in repayment — delinquent 61-90 days..... 149 27 16 — 192
Loans in repayment — delinquent greater than
90 days ............................... 254 60 32 — 346
Total ................................... $9,056 $2,354 $1,414 $10,826 23,650
Unamortized discount ...................... (668)
Receivable for partially charged-off loans........ 64
Allowance for loan losses ................... (458)
Total Managed Private Education Loans, net ..... $22,588
Loans in forbearance as a percentage of loans in
repayment and forbearance................. 12.2% 2.1% 1.8% —% 9.2%
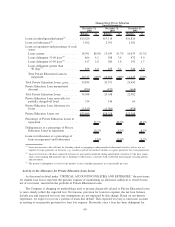
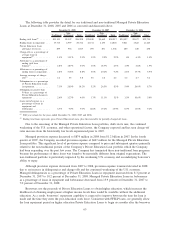
The table below stratifies the portfolio of Managed Private Education Loans in forbearance by the
cumulative number of months the borrower has used forbearance as of the dates indicated. As detailed in the
table below, 8 percent of loans currently in forbearance have cumulative forbearance of more than 24 months.
Forbearance
Balance
%of
Total
Forbearance
Balance
%of
Total
Forbearance
Balance
%of
Total
December 31,
2008
December 31,
2007
December 31,
2006
Cumulative number of months
borrower has used forbearance
Up to 12 months .............. $1,075 69% $1,641 69% $ 870 74%
13 to 24 months ............... 368 23 629 26 262 22
More than 24 months ........... 119 8 121 5 49 4
Total ....................... $1,562 100% $2,391 100% $1,181 100%
68