Sallie Mae 2008 Annual Report Download - page 73
Download and view the complete annual report
Please find page 73 of the 2008 Sallie Mae annual report below. You can navigate through the pages in the report by either clicking on the pages listed below, or by using the keyword search tool below to find specific information within the annual report.-
 1
1 -
2
-
3
-
4
-
5
-
6
-
7
-
8
-
9
-
10
-
11
-
12
-
13
-
14
-
15
-
16
-
17
-
18
-
19
-
20
-
21
-
22
-
23
-
24
-
25
-
26
-
27
-
28
-
29
-
30
-
31
-
32
-
33
-
34
-
35
-
36
-
37
-
38
-
39
-
40
-
41
-
42
-
43
-
44
-
45
-
46
-
47
-
48
-
49
-
50
-
51
-
52
-
53
-
54
-
55
-
56
-
57
-
58
-
59
-
60
-
61
-
62
-
 63
63 -
 64
64 -
 65
65 -
 66
66 -
 67
67 -
 68
68 -
 69
69 -
 70
70 -
 71
71 -
 72
72 -
 73
73 -
 74
74 -
 75
75 -
 76
76 -
 77
77 -
 78
78 -
 79
79 -
 80
80 -
 81
81 -
 82
82 -
 83
83 -
84
-
85
-
86
-
87
-
88
-
89
-
90
-
91
-
92
-
93
-
94
-
95
-
96
-
97
-
98
-
99
-
100
-
101
-
102
-
103
-
104
-
105
-
106
-
107
-
108
-
109
-
110
-
111
-
112
-
113
-
114
-
115
-
116
-
117
-
118
-
119
-
120
-
121
-
122
-
123
-
124
-
125
-
126
-
127
-
128
-
129
-
130
-
131
-
132
-
133
-
134
-
135
-
136
-
137
-
138
-
139
-
140
-
141
-
142
-
143
-
144
-
145
-
146
-
147
-
148
-
149
-
150
-
151
-
152
-
153
-
154
-
155
-
156
-
157
-
158
-
159
-
160
-
161
-
162
-
163
-
164
-
165
-
166
-
167
-
168
-
169
-
170
-
171
-
172
-
173
-
174
-
175
-
176
-
177
-
178
-
179
-
180
-
181
-
182
-
183
-
184
-
185
-
186
-
187
-
188
-
189
-
190
-
191
-
192
-
193
-
194
-
195
-
196
-
197
-
198
-
199
-
200
-
201
-
202
-
203
-
204
-
205
-
206
-
207
-
208
-
209
-
210
-
211
-
212
-
213
-
214
-
215
-
216
-
217
-
218
-
219
-
220
-
221
-
222
-
223
-
224
-
225
-
226
-
227
-
228
-
229
-
230
-
231
-
232
-
233
-
234
-
235
-
236
-
237
-
238
-
239
-
240
 |
 |

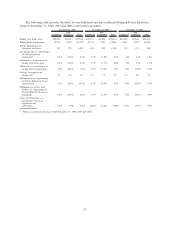
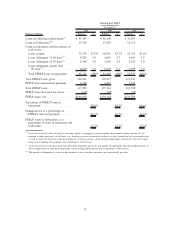
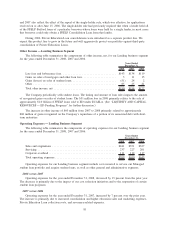
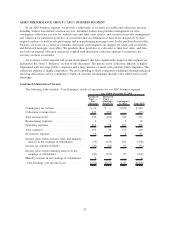
Activity in the Allowance for FFELP Loan Losses
The provision for student loan losses represents the periodic expense of maintaining an allowance
sufficient to absorb incurred Risk Sharing losses, in the portfolio of FFELP loans.
The following table summarizes changes in the allowance for FFELP loan losses for the years ended
December 31, 2008, 2007 and 2006.
2008 2007 2006 2008 2007 2006 2008 2007 2006
On-Balance Sheet
Years Ended December 31,
Off-Balance Sheet
Years Ended December 31,
Managed Basis
Years Ended December 31,
Activity in Allowance for FFELP Loans
Allowance at beginning of
period .............. $ 89 $ 20 $ 14 $ 29 $ 14 $ 11 $ 118 $ 34 $ 25
Provision for FFELP Loan
losses .............. 106 89 14 21 32 3 127 121 17
Charge-offs . . . ......... (58) (21) (5) (21) (15) (3) (79) (36) (8)
Student loan sales and
securitization activity .... 1 1 (3) (2) (2) 3 (1) (1) —
Allowance at end of period . . $ 138 $ 89 $ 20 $ 27 $ 29 $ 14 $ 165 $ 118 $ 34
Charge-offs as a percentage
of average loans in
repayment . . ......... .09% .04% .01% .13% .08% .01% .10% .05% .01%
Charge-offs as a percentage
of average loans in
repayment and
forbearance . ......... .07% .03% .01% .11% .07% .01% .08% .04% .01%
Allowance as a percentage of
the ending total loans,
gross . .............. .11% .08% .02% .12% .11% .04% .11% .09% .03%
Allowance as a percentage of
ending loans in
repayment . . ......... .20% .14% .04% .18% .17% .06% .19% .14% .05%
Average coverage of charge-
offs................ 2.39 4.18 4.03 1.27 1.90 4.73 2.09 3.23 4.28
Ending total loans, gross . . . $121,927 $107,165 $84,622 $22,134 $25,306 $32,612 $144,061 $132,471 $117,234
Average loans in
repayment . . ......... $ 66,392 $ 58,999 $47,155 $16,086 $18,624 $21,630 $ 82,478 $ 77,623 $ 68,785
Ending loans in repayment . . $ 70,174 $ 65,290 $53,126 $15,198 $17,296 $21,431 $ 85,372 $ 82,586 $ 74,557
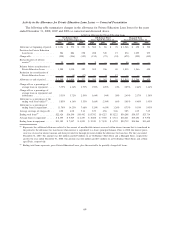
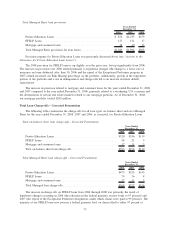
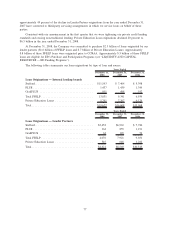
Total Provisions for Loan Losses
The following tables summarize the total loan provisions on both an on-balance sheet and on a Managed
Basis for the years ended December 31, 2008, 2007 and 2006.
Total on-balance sheet loan provisions
2008 2007 2006
Years Ended
December 31,
Private Education Loans ...................................... $586 $ 884 $258
FFELP Loans .............................................. 106 89 14
Mortgage and consumer loans .................................. 28 42 15
Total on-balance sheet provisions for loan losses .................... $720 $1,015 $287
72