Sallie Mae 2008 Annual Report Download - page 7
Download and view the complete annual report
Please find page 7 of the 2008 Sallie Mae annual report below. You can navigate through the pages in the report by either clicking on the pages listed below, or by using the keyword search tool below to find specific information within the annual report.-
 1
1 -
 2
2 -
 3
3 -
 4
4 -
 5
5 -
 6
6 -
 7
7 -
 8
8 -
 9
9 -
 10
10 -
 11
11 -
 12
12 -
 13
13 -
 14
14 -
 15
15 -
 16
16 -
 17
17 -
 18
18 -
19
-
20
-
21
-
22
-
23
-
24
-
25
-
26
-
27
-
28
-
29
-
30
-
31
-
32
-
33
-
34
-
35
-
36
-
37
-
38
-
39
-
40
-
41
-
42
-
43
-
44
-
45
-
46
-
47
-
48
-
49
-
50
-
51
-
52
-
53
-
54
-
55
-
56
-
57
-
58
-
59
-
60
-
61
-
62
-
63
-
64
-
65
-
66
-
67
-
68
-
69
-
70
-
71
-
72
-
73
-
74
-
75
-
76
-
77
-
78
-
79
-
80
-
81
-
82
-
83
-
84
-
85
-
86
-
87
-
88
-
89
-
90
-
91
-
92
-
93
-
94
-
95
-
96
-
97
-
98
-
99
-
100
-
101
-
102
-
103
-
104
-
105
-
106
-
107
-
108
-
109
-
110
-
111
-
112
-
113
-
114
-
115
-
116
-
117
-
118
-
119
-
120
-
121
-
122
-
123
-
124
-
125
-
126
-
127
-
128
-
129
-
130
-
131
-
132
-
133
-
134
-
135
-
136
-
137
-
138
-
139
-
140
-
141
-
142
-
143
-
144
-
145
-
146
-
147
-
148
-
149
-
150
-
151
-
152
-
153
-
154
-
155
-
156
-
157
-
158
-
159
-
160
-
161
-
162
-
163
-
164
-
165
-
166
-
167
-
168
-
169
-
170
-
171
-
172
-
173
-
174
-
175
-
176
-
177
-
178
-
179
-
180
-
181
-
182
-
183
-
184
-
185
-
186
-
187
-
188
-
189
-
190
-
191
-
192
-
193
-
194
-
195
-
196
-
197
-
198
-
199
-
200
-
201
-
202
-
203
-
204
-
205
-
206
-
207
-
208
-
209
-
210
-
211
-
212
-
213
-
214
-
215
-
216
-
217
-
218
-
219
-
220
-
221
-
222
-
223
-
224
-
225
-
226
-
227
-
228
-
229
-
230
-
231
-
232
-
233
-
234
-
235
-
236
-
237
-
238
-
239
-
240
 |
 |
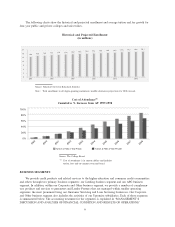
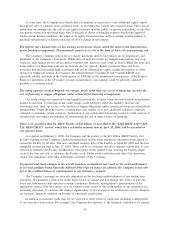
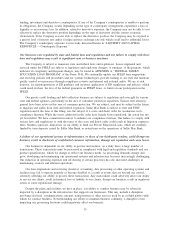
The following charts show the historical and projected enrollment and average tuition and fee growth for
four-year public and private colleges and universities.
Historical and Projected Enrollment
(in millions)
16.9 17.3 17.5 17.8 18.0 18.4
18.2 18.6 18.8 19.0 19.3 19.5 19.7 19.9 20.1
16.6
15.9
0
3
6
9
12
15
18
21
2001 2004 2007 2010 2013 2016
Source: National Center for Education Statistics
Note: Total enrollment in all degree-granting institutions; middle alternative projections for 2006 onward.
Cost of Attendance
(1)
Cumulative % Increase from AY 1997-1998
Tuition & Fees 4-Year Public Tuition & Fees 4-Year Private
2008
2007
2006
2005
2004
2003
2002
2001
2000
1999
0%
20%
40%
60%
80%
100%
Source: The College Board
(1)
Cost of attendance is in current dollars and includes
tuition, fees and on-campus room and board.
BUSINESS SEGMENTS
We provide credit products and related services to the higher education and consumer credit communities
and others through two primary business segments: our Lending business segment and our APG business
segment. In addition, within our Corporate and Other business segment, we provide a number of complemen-
tary products and services to guarantors and Lender Partners that are managed within smaller operating
segments, the most prominent being our Guarantor Servicing and Loan Servicing businesses. Our Corporate
and Other business segment also includes the activities of our Upromise subsidiaries. Each of these segments
is summarized below. The accounting treatment for the segments is explained in “MANAGEMENT’S
DISCUSSION AND ANALYSIS OF FINANCIAL CONDITION AND RESULTS OF OPERATIONS.”
6