Sallie Mae 2008 Annual Report Download - page 189
Download and view the complete annual report
Please find page 189 of the 2008 Sallie Mae annual report below. You can navigate through the pages in the report by either clicking on the pages listed below, or by using the keyword search tool below to find specific information within the annual report.-
 1
1 -
2
-
3
-
4
-
5
-
6
-
7
-
8
-
9
-
10
-
11
-
12
-
13
-
14
-
15
-
16
-
17
-
18
-
19
-
20
-
21
-
22
-
23
-
24
-
25
-
26
-
27
-
28
-
29
-
30
-
31
-
32
-
33
-
34
-
35
-
36
-
37
-
38
-
39
-
40
-
41
-
42
-
43
-
44
-
45
-
46
-
47
-
48
-
49
-
50
-
51
-
52
-
53
-
54
-
55
-
56
-
57
-
58
-
59
-
60
-
61
-
62
-
63
-
64
-
65
-
66
-
67
-
68
-
69
-
70
-
71
-
72
-
73
-
74
-
75
-
76
-
77
-
78
-
79
-
80
-
81
-
82
-
83
-
84
-
85
-
86
-
87
-
88
-
89
-
90
-
91
-
92
-
93
-
94
-
95
-
96
-
97
-
98
-
99
-
100
-
101
-
102
-
103
-
104
-
105
-
106
-
107
-
108
-
109
-
110
-
111
-
112
-
113
-
114
-
115
-
116
-
117
-
118
-
119
-
120
-
121
-
122
-
123
-
124
-
125
-
126
-
127
-
128
-
129
-
130
-
131
-
132
-
133
-
134
-
135
-
136
-
137
-
138
-
139
-
140
-
141
-
142
-
143
-
144
-
145
-
146
-
147
-
148
-
149
-
150
-
151
-
152
-
153
-
154
-
155
-
156
-
157
-
158
-
159
-
160
-
161
-
162
-
163
-
164
-
165
-
166
-
167
-
168
-
169
-
170
-
171
-
172
-
173
-
174
-
175
-
176
-
177
-
178
-
 179
179 -
 180
180 -
 181
181 -
 182
182 -
 183
183 -
 184
184 -
 185
185 -
 186
186 -
 187
187 -
 188
188 -
 189
189 -
 190
190 -
 191
191 -
 192
192 -
 193
193 -
 194
194 -
 195
195 -
 196
196 -
 197
197 -
 198
198 -
 199
199 -
200
-
201
-
202
-
203
-
204
-
205
-
206
-
207
-
208
-
209
-
210
-
211
-
212
-
213
-
214
-
215
-
216
-
217
-
218
-
219
-
220
-
221
-
222
-
223
-
224
-
225
-
226
-
227
-
228
-
229
-
230
-
231
-
232
-
233
-
234
-
235
-
236
-
237
-
238
-
239
-
240
 |
 |

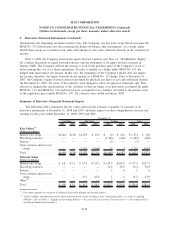
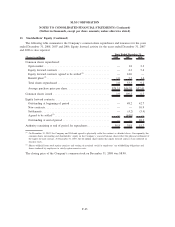
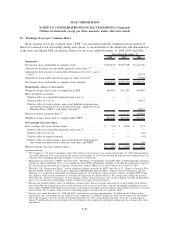
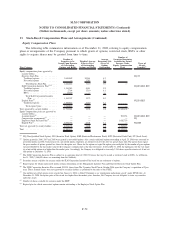
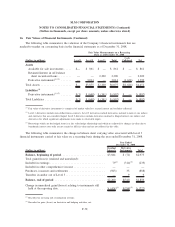
13. Stock-Based Compensation Plans and Arrangements (Continued)
2008 2007 2006
Years Ended December 31,
Risk-free interest rate .................................... 2.50% 4.88% 4.75%
Expected volatility ...................................... 44.05% 21.10% 20.22%
Expected dividend rate . . . ................................ 0.00% 2.20% 1.72%
Expected life of the option ................................ 3years 3 years 3 years
The expected life of the options is based on observed historical exercise patterns. Groups of employees
that have received similar option grant terms are considered separately for valuation purposes. The expected
volatility is based on implied volatility from publicly-traded options on the Company’s stock at the date of
grant and historical volatility of the Company’s stock. The risk-free interest rate is based on the U.S. Treasury
spot rate at the date of grant consistent with the expected life of the option. The dividend yield is based on the
projected annual dividend payment per share based on the dividend amount at the date of grant, divided by
the stock price at the date of grant.
As of December 31, 2008, there was $31 million of unrecognized compensation cost related to stock
options, which is expected to be recognized over a weighted average period of 1.7 years.
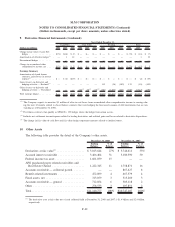
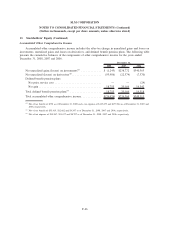
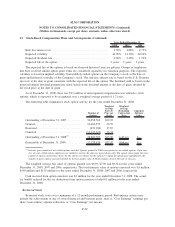
The following table summarizes stock option activity for the year ended December 31, 2008.
Number of
Options
Weighted
Average
Exercise
Price per
Share
Weighted
Average
Remaining
Contractual
Term
Aggregate
Intrinsic
Value
Outstanding at December 31, 2007 ........... 36,658,764 $39.92
Granted ............................... 14,664,550 20.55
Exercised .............................. (293,186) 17.87
Canceled .............................. (12,225,424) 36.34
Outstanding at December 31, 2008
(1)
......... 38,804,704 $33.90 6.40 yrs $—
Exercisable at December 31, 2008 ........... 22,179,634 $37.42 4.86 yrs $—
(1)
Includes gross number of net-settled options awarded. Options granted in 2008 were granted as net-settled options. Upon exer-
cise of a net-settled option, employees are entitled to receive the after-tax spread shares only. The spread shares equal the gross
number of options granted less shares for the option cost. Shares for the option cost equal the option price multiplied by the
number of gross options exercised divided by the fair market value of SLM common stock at the time of exercise.
The weighted average fair value of options granted was $6.93, $7.89 and $9.34 for the years ended
December 31, 2008, 2007 and 2006, respectively. The total intrinsic value of options exercised was $.8 million,
$140 million and $129 million for the years ended December 31, 2008, 2007 and 2006, respectively.
Cash received from option exercises was $2 million for the year ended December 31, 2008. The actual
tax benefit realized for the tax deductions from option exercises totaled $1 million for the year ended
December 31, 2008.
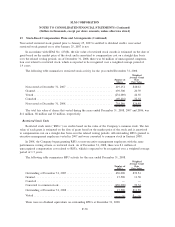
Restricted Stock
Restricted stock vests over a minimum of a 12-month performance period. Performance criteria may
include the achievement of any of several financial and business goals, such as “Core Earnings” earnings per
share, loan volume, expense reduction, or “Core Earnings” net income.
F-69
SLM CORPORATION
NOTES TO CONSOLIDATED FINANCIAL STATEMENTS (Continued)
(Dollars in thousands, except per share amounts, unless otherwise stated)