SunTrust 2008 Annual Report Download - page 99
Download and view the complete annual report
Please find page 99 of the 2008 SunTrust annual report below. You can navigate through the pages in the report by either clicking on the pages listed below, or by using the keyword search tool below to find specific information within the annual report.-
 1
1 -
2
-
3
-
4
-
5
-
6
-
7
-
8
-
9
-
10
-
11
-
12
-
13
-
14
-
15
-
16
-
17
-
18
-
19
-
20
-
21
-
22
-
23
-
24
-
25
-
26
-
27
-
28
-
29
-
30
-
31
-
32
-
33
-
34
-
35
-
36
-
37
-
38
-
39
-
40
-
41
-
42
-
43
-
44
-
45
-
46
-
47
-
48
-
49
-
50
-
51
-
52
-
53
-
54
-
55
-
56
-
57
-
58
-
59
-
60
-
61
-
62
-
63
-
64
-
65
-
66
-
67
-
68
-
69
-
70
-
71
-
72
-
73
-
74
-
75
-
76
-
77
-
78
-
79
-
80
-
81
-
82
-
83
-
84
-
85
-
86
-
87
-
88
-
 89
89 -
 90
90 -
 91
91 -
 92
92 -
 93
93 -
 94
94 -
 95
95 -
 96
96 -
 97
97 -
 98
98 -
 99
99 -
 100
100 -
 101
101 -
 102
102 -
 103
103 -
 104
104 -
 105
105 -
 106
106 -
 107
107 -
 108
108 -
 109
109 -
110
-
111
-
112
-
113
-
114
-
115
-
116
-
117
-
118
-
119
-
120
-
121
-
122
-
123
-
124
-
125
-
126
-
127
-
128
-
129
-
130
-
131
-
132
-
133
-
134
-
135
-
136
-
137
-
138
-
139
-
140
-
141
-
142
-
143
-
144
-
145
-
146
-
147
-
148
-
149
-
150
-
151
-
152
-
153
-
154
-
155
-
156
-
157
-
158
-
159
-
160
-
161
-
162
-
163
-
164
-
165
-
166
-
167
-
168
-
169
-
170
-
171
-
172
-
173
-
174
-
175
-
176
-
177
-
178
-
179
-
180
-
181
-
182
-
183
-
184
-
185
-
186
-
187
-
188
 |
 |

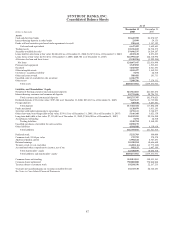
SUNTRUST BANKS, INC.
Consolidated Balance Sheets
As of
(Dollars in thousands)
December 31
2008
December 31
2007
Assets
Cash and due from banks $5,622,789 $4,270,917
Interest-bearing deposits in other banks 23,999 24,355
Funds sold and securities purchased under agreements to resell 990,614 1,347,329
Cash and cash equivalents 6,637,402 5,642,601
Trading assets 10,396,269 10,518,379
Securities available for sale119,696,537 16,264,107
Loans held for sale (loans at fair value: $2,424,432 as of December 31, 2008; $6,325,160 as of December 31, 2007) 4,032,128 8,851,695
Loans (loans at fair value: $270,342 as of December 31, 2008; $220,784 as of December 31, 2007) 126,998,443 122,318,994
Allowance for loan and lease losses (2,350,996) (1,282,504)
Net loans 124,647,447 121,036,490
Premises and equipment 1,547,892 1,595,691
Goodwill 7,043,503 6,921,493
Other intangible assets 1,035,427 1,362,995
Customers’ acceptance liability 5,294 22,418
Other real estate owned 500,481 183,753
Unsettled sales of available for sale securities 6,386,795 -
Other assets 7,208,786 7,174,311
Total assets $189,137,961 $179,573,933
Liabilities and Shareholders’ Equity
Noninterest-bearing consumer and commercial deposits $21,522,021 $21,083,234
Interest-bearing consumer and commercial deposits 83,753,686 80,786,791
Total consumer and commercial deposits 105,275,707 101,870,025
Brokered deposits (CDs at fair value: $587,486 as of December 31, 2008; $234,345 as of December 31, 2007) 7,667,167 11,715,024
Foreign deposits 385,510 4,257,601
Total deposits 113,328,384 117,842,650
Funds purchased 1,120,079 3,431,185
Securities sold under agreements to repurchase 3,193,311 5,748,277
Other short-term borrowings (debt at fair value: $399,611 as of December 31, 2008, $0 as of December 31, 2007) 5,166,360 3,021,358
Long-term debt (debt at fair value: $7,155,684 as of December 31, 2008; $7,446,980 as of December 31, 2007) 26,812,381 22,956,508
Acceptances outstanding 5,294 22,418
Trading liabilities 3,240,784 2,160,385
Unsettled purchases of available for sale securities 8,898,279 -
Other liabilities 4,984,980 6,338,634
Total liabilities 166,749,852 161,521,415
Preferred stock 5,221,703 500,000
Common stock, $1.00 par value 372,799 370,578
Additional paid in capital 6,904,644 6,707,293
Retained earnings 10,388,984 10,646,640
Treasury stock, at cost, and other (1,481,146) (1,779,142)
Accumulated other comprehensive income, net of tax 981,125 1,607,149
Total shareholders’ equity 22,388,109 18,052,518
Total liabilities and shareholders’ equity $189,137,961 $179,573,933
Common shares outstanding 354,515,013 348,411,163
Common shares authorized 750,000,000 750,000,000
Treasury shares of common stock 18,284,356 22,167,235
1Includes net unrealized gains on securities available for sale $1,413,330 $2,724,643
See Notes to Consolidated Financial Statements.
87