SunTrust 2008 Annual Report Download - page 35
Download and view the complete annual report
Please find page 35 of the 2008 SunTrust annual report below. You can navigate through the pages in the report by either clicking on the pages listed below, or by using the keyword search tool below to find specific information within the annual report.-
 1
1 -
2
-
3
-
4
-
5
-
6
-
7
-
8
-
9
-
10
-
11
-
12
-
13
-
14
-
15
-
16
-
17
-
18
-
19
-
20
-
21
-
22
-
23
-
24
-
 25
25 -
 26
26 -
 27
27 -
 28
28 -
 29
29 -
 30
30 -
 31
31 -
 32
32 -
 33
33 -
 34
34 -
 35
35 -
 36
36 -
 37
37 -
 38
38 -
 39
39 -
 40
40 -
 41
41 -
 42
42 -
 43
43 -
 44
44 -
 45
45 -
46
-
47
-
48
-
49
-
50
-
51
-
52
-
53
-
54
-
55
-
56
-
57
-
58
-
59
-
60
-
61
-
62
-
63
-
64
-
65
-
66
-
67
-
68
-
69
-
70
-
71
-
72
-
73
-
74
-
75
-
76
-
77
-
78
-
79
-
80
-
81
-
82
-
83
-
84
-
85
-
86
-
87
-
88
-
89
-
90
-
91
-
92
-
93
-
94
-
95
-
96
-
97
-
98
-
99
-
100
-
101
-
102
-
103
-
104
-
105
-
106
-
107
-
108
-
109
-
110
-
111
-
112
-
113
-
114
-
115
-
116
-
117
-
118
-
119
-
120
-
121
-
122
-
123
-
124
-
125
-
126
-
127
-
128
-
129
-
130
-
131
-
132
-
133
-
134
-
135
-
136
-
137
-
138
-
139
-
140
-
141
-
142
-
143
-
144
-
145
-
146
-
147
-
148
-
149
-
150
-
151
-
152
-
153
-
154
-
155
-
156
-
157
-
158
-
159
-
160
-
161
-
162
-
163
-
164
-
165
-
166
-
167
-
168
-
169
-
170
-
171
-
172
-
173
-
174
-
175
-
176
-
177
-
178
-
179
-
180
-
181
-
182
-
183
-
184
-
185
-
186
-
187
-
188
 |
 |

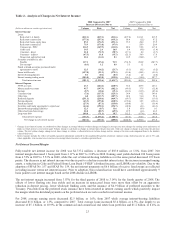
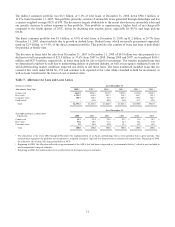
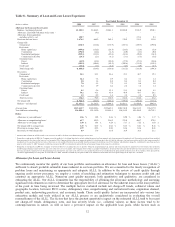
Table 2 - Analysis of Changes in Net Interest Income1
2008 Compared to 2007
Increase (Decrease) Due to
2007 Compared to 2006
Increase (Decrease) Due to
(Dollars in millions on a taxable-equivalent basis) Volume Rate Net Volume Rate Net
Interest Income
Loans:
Real estate 1-4 family ($12.3) ($19.3) ($31.6) ($97.2) $111.1 $13.9
Real estate construction (177.6) (257.6) (435.2) 88.4 (1.2) 87.2
Real estate home equity lines 85.2 (376.5) (291.3) 35.5 20.4 55.9
Real estate commercial 75.9 (173.8) (97.9) - 20.9 20.9
Commercial - FTE2236.9 (349.9) (113.0) 22.4 92.8 115.2
Credit card 14.5 2.4 16.9 8.4 (9.8) (1.4)
Consumer - direct 21.8 (72.5) (50.7) (17.1) 8.4 (8.7)
Consumer - indirect (47.5) 11.8 (35.7) (21.1) 38.9 17.8
Nonaccrual and restructured 22.4 (14.3) 8.1 10.9 (10.2) 0.7
Securities available for sale:
Taxable 117.3 (25.4) 91.9 (761.9) 254.2 (507.7)
Tax-exempt 2(0.3) 1.2 0.9 5.3 1.1 6.4
Funds sold and securities purchased under
agreements to resell 12.5 (36.2) (23.7) (8.1) (0.1) (8.2)
Loans held for sale (327.0) (52.1) (379.1) (19.0) (40.1) (59.1)
Interest-bearing deposits 0.1 (0.6) (0.5) (3.2) 1.2 (2.0)
Interest earning trading assets (203.0) (149.8) (352.8) 546.3 (18.6) 527.7
Total interest income (181.1) (1,512.6) (1,693.7) (210.4) 469.0 258.6
Interest Expense
NOW accounts 23.3 (244.2) (220.9) 56.6 109.5 166.1
Money market accounts 95.7 (197.9) (102.2) (49.5) 37.5 (12.0)
Savings (8.7) (30.6) (39.3) (10.3) (13.3) (23.6)
Consumer time (7.6) (117.5) (125.1) 54.4 95.2 149.6
Other time 6.0 (113.7) (107.7) 42.4 51.0 93.4
Brokered deposits (251.1) (218.6) (469.7) (69.7) 50.4 (19.3)
Foreign deposits (63.5) (155.0) (218.5) (170.4) 12.3 (158.1)
Funds purchased (27.9) (87.1) (115.0) (60.0) 3.6 (56.4)
Securities sold under agreements to repurchase (44.6) (150.1) (194.7) (42.2) (4.1) (46.3)
Interest-bearing trading liabilities 12.3 (0.7) 11.6 1.0 (0.9) 0.1
Other short-term borrowings 22.8 (88.7) (65.9) 47.9 (1.4) 46.5
Long-term debt 109.8 (71.1) 38.7 112.2 (67.4) 44.8
Total interest expense (133.5) (1,475.2) (1,608.7) (87.6) 272.4 184.8
Net change in net interest income ($47.6) ($37.4) ($85.0) ($122.8) $196.6 $73.8
1Changes in net interest income are attributed to either changes in average balances (volume change) or changes in average rates (rate change) for earning assets and sources of
funds on which interest is received or paid. Volume change is calculated as change in volume times the previous rate, while rate change is change in rate times the previous
volume. The rate/volume change, change in rate times change in volume, is allocated between volume change and rate change at the ratio each component bears to the absolute
value of their total.
2Interest income includes the effects of taxable-equivalent adjustments (reduced by the nondeductible portion of interest expense) using a federal income tax rate of 35% and,
where applicable, state income taxes to increase tax-exempt interest income to a taxable-equivalent basis.
Net Interest Income/Margin
Fully-taxable net interest income for 2008 was $4,737.2 million, a decrease of $85.0 million, or 1.8%, from 2007. Net
interest margin decreased 1 basis point from 3.11% in 2007 to 3.10% in 2008. Earning asset yields declined 100 basis points
from 6.53% in 2007 to 5.53% in 2008, while the cost of interest-bearing liabilities over the same period decreased 119 basis
points. The decrease in net interest income was due in part to a decline in market interest rates, the increase in nonperforming
assets, a reduction in Coke and Federal Home Loan Bank (“FHLB”) dividend income, and LIBOR rate volatility. Due to the
adoption of SFAS No. 157 and SFAS No. 159, the net interest payments on $6.6 billion of receive fixed swaps are reflected
in trading income versus net interest income. Prior to adoption, this reclassification would have contributed approximately 9
basis points to net interest margin based on the 2008 decline in LIBOR.
The net interest margin increased from 3.07% for the third quarter of 2008 to 3.14% for the fourth quarter of 2008. The
effects of lower floating rate loan yields and an increase in nonaccrual loans were more than offset by an aggressive
reduction in deposit pricing, lower wholesale funding costs, and the issuance of $4.9 billion of preferred securities to the
Treasury. Proceeds from the preferred stock issuance have been invested in interest earning assets which positively impact
the margin while the dividend payments on the preferred stock are not recorded in net interest income.
For 2008, average earning assets decreased $2.5 billion, or 1.6%, from 2007 while average interest-bearing liabilities
decreased $1.8 billion, or 1.3%, compared to 2007. Total average loans increased $5.4 billion, or 4.5%, due largely to an
increase of $5.1 billion, or 10.9%, in the commercial and commercial real estate loan portfolios and $1.2 billion, or 8.4%, in
23