SunTrust 2008 Annual Report Download - page 79
Download and view the complete annual report
Please find page 79 of the 2008 SunTrust annual report below. You can navigate through the pages in the report by either clicking on the pages listed below, or by using the keyword search tool below to find specific information within the annual report.-
 1
1 -
2
-
3
-
4
-
5
-
6
-
7
-
8
-
9
-
10
-
11
-
12
-
13
-
14
-
15
-
16
-
17
-
18
-
19
-
20
-
21
-
22
-
23
-
24
-
25
-
26
-
27
-
28
-
29
-
30
-
31
-
32
-
33
-
34
-
35
-
36
-
37
-
38
-
39
-
40
-
41
-
42
-
43
-
44
-
45
-
46
-
47
-
48
-
49
-
50
-
51
-
52
-
53
-
54
-
55
-
56
-
57
-
58
-
59
-
60
-
61
-
62
-
63
-
64
-
65
-
66
-
67
-
68
-
 69
69 -
 70
70 -
 71
71 -
 72
72 -
 73
73 -
 74
74 -
 75
75 -
 76
76 -
 77
77 -
 78
78 -
 79
79 -
 80
80 -
 81
81 -
 82
82 -
 83
83 -
 84
84 -
 85
85 -
 86
86 -
 87
87 -
 88
88 -
 89
89 -
90
-
91
-
92
-
93
-
94
-
95
-
96
-
97
-
98
-
99
-
100
-
101
-
102
-
103
-
104
-
105
-
106
-
107
-
108
-
109
-
110
-
111
-
112
-
113
-
114
-
115
-
116
-
117
-
118
-
119
-
120
-
121
-
122
-
123
-
124
-
125
-
126
-
127
-
128
-
129
-
130
-
131
-
132
-
133
-
134
-
135
-
136
-
137
-
138
-
139
-
140
-
141
-
142
-
143
-
144
-
145
-
146
-
147
-
148
-
149
-
150
-
151
-
152
-
153
-
154
-
155
-
156
-
157
-
158
-
159
-
160
-
161
-
162
-
163
-
164
-
165
-
166
-
167
-
168
-
169
-
170
-
171
-
172
-
173
-
174
-
175
-
176
-
177
-
178
-
179
-
180
-
181
-
182
-
183
-
184
-
185
-
186
-
187
-
188
 |
 |

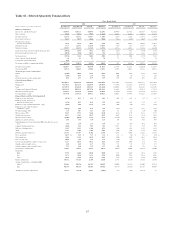
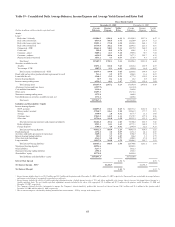
Table 18 - Selected Quarterly Financial Data
Three Months Ended
2008 2007
(Dollars in millions, except per share and other data) December 31 September 30 June 30 March 31 December 31 September 30 June 30 March 31
Summary of Operations
Interest, fees, and dividend income $1,985.4 $2,017.3 $2,066.4 $2,258.3 $2,448.7 $2,515.3 $2,543.9 $2,528.0
Interest expense 808.5 871.1 909.7 1,118.5 1,281.1 1,323.1 1,348.6 1,363.5
Net interest income 1,176.9 1,146.2 1,156.7 1,139.8 1,167.6 1,192.2 1,195.3 1,164.5
Provision for loan losses 962.5 503.7 448.0 560.0 356.8 147.0 104.7 56.4
Net interest income after
provision for loan losses 214.4 642.5 708.7 579.8 810.8 1,045.2 1,090.6 1,108.1
Noninterest income 1717.7 1,285.2 1,413.0 1,057.5 576.0 819.1 1,154.6 878.9
Noninterest expense 1,588.7 1,668.1 1,378.5 1,255.1 1,455.4 1,291.2 1,251.2 1,236.0
Income/(loss) before provision (benefit) for income taxes (656.6) 259.6 743.2 382.2 (68.6) 573.1 994.0 751.0
Provision (benefit) for income taxes (309.0) (52.8) 202.8 91.6 (79.7) 152.9 312.6 229.7
Net income/(loss) (347.6) 312.4 540.4 290.6 11.1 420.2 681.4 521.3
Series A preferred stock dividends 5.0 5.1 5.1 7.0 7.8 7.6 7.5 7.4
U.S. Treasury preferred dividends 26.6 - - - ----
Net income available to common shareholders ($379.2) $307.3 $535.3 $283.6 $3.3 $412.6 $673.9 $513.9
Net interest income-FTE $1,208.7 $1,175.7 $1,185.0 $1,167.8 $1,194.8 $1,219.2 $1,220.0 $1,188.3
Total revenue-FTE 1,926.5 2,460.9 2,598.0 2,225.3 1,770.8 2,038.3 2,374.6 2,067.2
Net income per average common share
Diluted ($1.08) $0.88 $1.53 $0.81 $0.01 $1.18 $1.89 $1.44
Basic (1.08) 0.88 1.53 0.82 0.01 1.19 1.91 1.45
Dividends paid per average common share 0.54 0.77 0.77 0.77 0.73 0.73 0.73 0.73
Selected Average Balances
Total assets $177,047.3 $173,888.5 $175,548.8 $176,916.9 $175,130.5 $174,653.4 $179,996.5 $181,506.4
Earning assets 153,187.9 152,319.8 152,483.0 153,003.6 151,541.0 152,327.6 157,594.2 159,473.6
Loans 127,607.9 125,642.0 125,191.9 123,263.0 121,094.3 119,558.6 118,164.6 121,514.9
Consumer and commercial deposits 102,238.4 100,199.8 101,727.0 101,168.4 99,648.5 96,707.6 97,926.3 97,792.3
Brokered and foreign deposits 12,648.7 15,799.8 15,068.3 15,468.6 15,717.0 21,139.9 23,983.4 26,714.1
Total shareholders’ equity 19,778.0 17,981.9 18,093.2 18,061.7 18,032.8 17,550.2 17,928.1 17,720.4
Financial Ratios and Other Data (Annualized)
Return on average total assets (0.78) % 0.71 % 1.24 % 0.66 % 0.03 % 0.95 % 1.52 % 1.16 %
Return on average assets less net
unrealized securities gains (1.39) 0.45 0.42 0.72 (0.01) 0.93 1.18 1.15
Return on average common shareholders’ equity (8.63) 6.99 12.24 6.49 0.07 9.60 15.51 12.10
Return on average realized common
shareholders’ equity (15.54) 4.55 4.36 7.69 (0.33) 9.86 12.71 12.54
Net interest margin- FTE 3.14 3.07 3.13 3.07 3.13 3.18 3.10 3.02
Efficiency ratio- FTE 82.47 67.78 53.06 56.40 82.19 63.35 52.69 59.79
Tangible efficiency ratio 81.57 67.03 50.57 55.47 80.86 62.13 51.64 58.65
Effective tax rate (benefit) (47.06) (20.32) 27.29 23.98 (116.22) 26.68 31.45 30.59
Allowance to period-end loans 1.86 1.54 1.46 1.25 1.05 0.91 0.88 0.88
Nonperforming assets to total loans plus OREO and other repossessed
assets 3.49 2.90 2.36 1.85 1.35 0.97 0.73 0.64
Common dividend payout ratio (50.4) 88.6 50.8 94.8 7,788.6 61.6 38.5 50.6
Full-service banking offices 1,692 1,692 1,699 1,678 1,682 1,683 1,685 1,691
ATMs 2,582 2,506 2,506 2,509 2,507 2,518 2,533 2,543
Full-time equivalent employees 29,333 29,447 31,602 31,745 32,323 32,903 33,241 33,397
Tier 1 capital ratio 10.87 % 8.15 % 7.47 % 7.23 % 6.93 % 7.44 % 7.49 % 7.60 %
Total capital ratio 14.04 11.16 10.85 10.97 10.30 10.72 10.67 10.94
Tier 1 leverage ratio 10.45 7.98 7.54 7.22 6.90 7.28 7.11 7.24
Total average shareholders’ equity to average assets 11.17 10.34 10.31 10.21 10.30 10.05 9.96 9.76
Tangible equity to tangible assets 8.40 6.40 6.27 6.56 6.31 6.36 5.85 5.97
Tangible common equity to tangible assets 5.53 6.10 5.97 6.27 6.02 6.06 5.56 5.69
Book value per common share $48.42 $49.32 $49.24 $51.26 $50.38 $50.01 $48.33 $49.00
Market Price:
High 57.75 64.00 60.80 70.00 78.76 90.47 94.18 87.43
Low 19.75 25.60 32.34 52.94 60.02 73.61 78.16 80.76
Close 29.54 44.99 36.22 55.14 62.49 75.67 85.74 83.04
Market capitalization 10,472 15,925 12,805 19,290 21,772 26,339 29,928 29,604
Average common shares outstanding (000s)
Diluted 351,882 350,970 349,783 348,072 348,072 349,592 356,008 357,214
Basic 350,439 349,916 348,714 346,581 345,917 346,150 351,987 353,448
1Includes net securities gains/(losses) $411.1 $173.0 $549.8 ($60.6) $5.7 $1.0 $236.4 $-
67