SunTrust 2008 Annual Report Download - page 47
Download and view the complete annual report
Please find page 47 of the 2008 SunTrust annual report below. You can navigate through the pages in the report by either clicking on the pages listed below, or by using the keyword search tool below to find specific information within the annual report.-
 1
1 -
2
-
3
-
4
-
5
-
6
-
7
-
8
-
9
-
10
-
11
-
12
-
13
-
14
-
15
-
16
-
17
-
18
-
19
-
20
-
21
-
22
-
23
-
24
-
25
-
26
-
27
-
28
-
29
-
30
-
31
-
32
-
33
-
34
-
35
-
36
-
 37
37 -
 38
38 -
 39
39 -
 40
40 -
 41
41 -
 42
42 -
 43
43 -
 44
44 -
 45
45 -
 46
46 -
 47
47 -
 48
48 -
 49
49 -
 50
50 -
 51
51 -
 52
52 -
 53
53 -
 54
54 -
 55
55 -
 56
56 -
 57
57 -
58
-
59
-
60
-
61
-
62
-
63
-
64
-
65
-
66
-
67
-
68
-
69
-
70
-
71
-
72
-
73
-
74
-
75
-
76
-
77
-
78
-
79
-
80
-
81
-
82
-
83
-
84
-
85
-
86
-
87
-
88
-
89
-
90
-
91
-
92
-
93
-
94
-
95
-
96
-
97
-
98
-
99
-
100
-
101
-
102
-
103
-
104
-
105
-
106
-
107
-
108
-
109
-
110
-
111
-
112
-
113
-
114
-
115
-
116
-
117
-
118
-
119
-
120
-
121
-
122
-
123
-
124
-
125
-
126
-
127
-
128
-
129
-
130
-
131
-
132
-
133
-
134
-
135
-
136
-
137
-
138
-
139
-
140
-
141
-
142
-
143
-
144
-
145
-
146
-
147
-
148
-
149
-
150
-
151
-
152
-
153
-
154
-
155
-
156
-
157
-
158
-
159
-
160
-
161
-
162
-
163
-
164
-
165
-
166
-
167
-
168
-
169
-
170
-
171
-
172
-
173
-
174
-
175
-
176
-
177
-
178
-
179
-
180
-
181
-
182
-
183
-
184
-
185
-
186
-
187
-
188
 |
 |

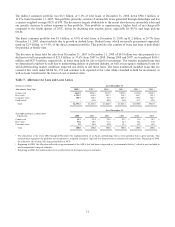
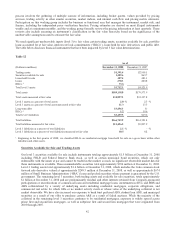
Table 9 - Nonperforming Assets
As of December 31,
(Dollars in millions) 2008 2007 2006 2005 2004 2003
Nonperforming Assets
Nonaccrual/nonperforming loans
Commercial $322.0 $74.5 $106.8 $70.9 $130.9 $165.9
Real estate
Construction 1,276.8 295.3 38.6 24.4 32.8 4.4
Residential mortgages 1,847.0 841.4 266.0 95.7 104.1 83.7
Home equity lines 272.6 135.7 13.5 7.6 0.4 1.7
Commercial real estate 176.6 44.5 55.4 44.6 36.7 48.6
Consumer loans 45.0 39.0 23.5 28.7 49.3 32.2
Total nonaccrual/nonperforming loans 3,940.0 1,430.4 503.8 271.9 354.2 336.5
Other real estate owned (“OREO”) 500.5 183.7 55.4 30.7 28.6 16.5
Other repossessed assets 15.9 11.5 6.6 7.2 8.8 10.3
Total nonperforming assets $4,456.4 $1,625.6 $565.8 $309.8 $391.6 $363.3
Ratios:
Nonperforming loans to total loans13.10 % 1.17 % 0.41 % 0.24 % 0.35 % 0.42 %
Nonperforming assets to total loans
plus OREO and other repossessed assets13.49 1.33 0.47 0.27 0.39 0.45
Restructured loans (accruing) 462.6 29.9 28.0 24.4 19.1 14.8
Accruing loans past due 90 days or more $1,032.3 $611.0 $351.5 $371.5 $214.3 $196.4
1During the third quarter of 2008, we revised our definition of nonperforming loans to exclude loans that have been restructured and remain on accruing status. These loans are not
considered to be nonperforming because they are performing in accordance with the restructured terms. This change better aligns our definition of nonperforming loans and
nonperforming assets with the one used by peer institutions and therefore improves comparability of this measure across the industry.
Nonperforming Assets
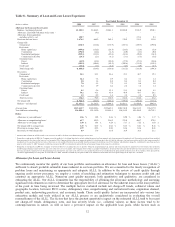
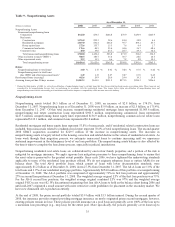
Nonperforming assets totaled $4.5 billion as of December 31, 2008, an increase of $2.8 billion, or 174.1%, from
December 31, 2007. Nonperforming loans as of December 31, 2008 were $3.9 billion, an increase of $2.5 billion, or 175.4%,
from December 31, 2007. Of this total increase, nonperforming residential mortgage loans represented $1,005.6 million,
nonperforming real estate construction loans represented $981.5 million, nonperforming commercial loans represented
$247.5 million, nonperforming home equity lines represented $136.9 million, nonperforming commercial real estate loans
represented $132.1 million, and consumer loans represented $6.0 million.
Residential mortgages and home equity lines represent 53.8% of nonaccruals, and if residential related construction loans are
included, then nonaccruals related to residential real estate represent 70.6% of total nonperforming loans. The second quarter
2008 GB&T acquisition accounted for $229.5 million of the increase in nonperforming assets. The increases in
nonperforming assets is largely related to the housing correction and related decline in the values of residential real estate. As
loans work through their migration process, we anticipate nonaccrual loans to continue increasing until we experience
sustained improvement in the delinquency level of our loan portfolios. The nonperforming assets balance is also affected by
the time it takes to complete the foreclosure process, especially in judicial jurisdictions.
Nonperforming residential real estate loans are collateralized by one-to-four family properties and a portion of the risk is
mitigated by mortgage insurance. We apply rigorous loss mitigation processes to these nonperforming loans to ensure that
the asset value is preserved to the greatest extent possible. Since early 2006, we have tightened the underwriting standards
applicable to many of the residential loan products offered. We do not originate subprime loans or option ARMs for our
balance sheet. The total Alt-A portfolio loans, which consist of loans with lower documentation standards, were
approximately $1.2 billion as of December 31, 2008, down 27.3% from December 31, 2007. The Alt-A loans are 1.0% of the
total loans and 3.9% of our residential mortgage portfolio. Approximately $254.0 million of this portfolio was nonperforming
at December 31, 2008. The Alt-A portfolio was comprised of approximately 73% in first lien positions and approximately
27% in second lien positions at December 31, 2008. The weighted average original LTV of the first lien positions was 75%.
For the Alt-A second lien positions, the weighted average original combined LTV was 97% and the weighted average
original FICO score was 682. We discontinued originating first lien Alt-A loans to hold on the balance sheet during 2006 and
until mid-2007 originated a small amount with more restrictive credit guidelines for placement in the secondary market. We
have now eliminated Alt-A production entirely.
At the end of 2008, the prime second portfolio totaled $3.9 billion with $3.5 billion insured. During the second quarter of
2008, the insurance provider stopped providing mortgage insurance on newly originated prime second mortgages; however,
existing policies remain in force. These policies provide insurance on a pool basis and generally cover 100% of the loss up to
a maximum loss percentage (e.g., stop loss) for the entire pool. More specifically, the policies generally cover losses up to
35