SunTrust 2008 Annual Report Download - page 39
Download and view the complete annual report
Please find page 39 of the 2008 SunTrust annual report below. You can navigate through the pages in the report by either clicking on the pages listed below, or by using the keyword search tool below to find specific information within the annual report.-
 1
1 -
2
-
3
-
4
-
5
-
6
-
7
-
8
-
9
-
10
-
11
-
12
-
13
-
14
-
15
-
16
-
17
-
18
-
19
-
20
-
21
-
22
-
23
-
24
-
25
-
26
-
27
-
28
-
 29
29 -
 30
30 -
 31
31 -
 32
32 -
 33
33 -
 34
34 -
 35
35 -
 36
36 -
 37
37 -
 38
38 -
 39
39 -
 40
40 -
 41
41 -
 42
42 -
 43
43 -
 44
44 -
 45
45 -
 46
46 -
 47
47 -
 48
48 -
 49
49 -
50
-
51
-
52
-
53
-
54
-
55
-
56
-
57
-
58
-
59
-
60
-
61
-
62
-
63
-
64
-
65
-
66
-
67
-
68
-
69
-
70
-
71
-
72
-
73
-
74
-
75
-
76
-
77
-
78
-
79
-
80
-
81
-
82
-
83
-
84
-
85
-
86
-
87
-
88
-
89
-
90
-
91
-
92
-
93
-
94
-
95
-
96
-
97
-
98
-
99
-
100
-
101
-
102
-
103
-
104
-
105
-
106
-
107
-
108
-
109
-
110
-
111
-
112
-
113
-
114
-
115
-
116
-
117
-
118
-
119
-
120
-
121
-
122
-
123
-
124
-
125
-
126
-
127
-
128
-
129
-
130
-
131
-
132
-
133
-
134
-
135
-
136
-
137
-
138
-
139
-
140
-
141
-
142
-
143
-
144
-
145
-
146
-
147
-
148
-
149
-
150
-
151
-
152
-
153
-
154
-
155
-
156
-
157
-
158
-
159
-
160
-
161
-
162
-
163
-
164
-
165
-
166
-
167
-
168
-
169
-
170
-
171
-
172
-
173
-
174
-
175
-
176
-
177
-
178
-
179
-
180
-
181
-
182
-
183
-
184
-
185
-
186
-
187
-
188
 |
 |

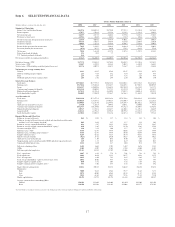
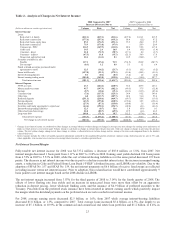
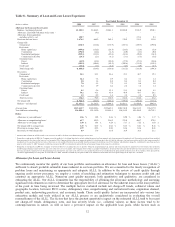
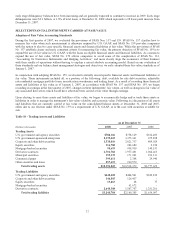
Table 4 - Noninterest Expense
Year Ended December 31
(Dollars in millions) 2008 2007 2006 2005 2004 2003
Employee compensation $2,327.2 $2,329.0 $2,253.5 $2,117.2 $1,804.9 $1,585.9
Employee benefits 434.0 441.2 471.9 417.1 363.4 358.6
Total personnel expense 2,761.2 2,770.2 2,725.4 2,534.3 2,168.3 1,944.5
Outside processing and software 492.6 410.9 393.6 357.4 286.3 246.7
Operating losses 446.2 134.0 44.6 40.3 42.8 35.5
Marketing and customer development 372.2 195.0 173.2 156.7 128.3 100.3
Net occupancy expense 347.3 351.2 334.2 312.1 268.2 237.3
Equipment expense 203.2 206.5 197.0 204.0 184.9 178.4
Mortgage reinsurance 179.9 -----
Credit and collection services 156.4 112.5 101.6 84.9 66.7 70.3
Amortization/impairment of intangible assets 121.3 96.7 103.2 119.0 77.6 64.5
Other real estate expense/(income) 104.7 15.8 0.2 (1.2) (1.8) (2.0)
Postage and delivery 90.1 93.2 92.7 85.4 69.8 69.0
Other staff expense 70.3 132.5 92.5 90.1 66.0 60.4
Communications 69.4 79.0 72.9 79.2 67.2 61.3
Consulting and legal 58.6 101.2 113.0 112.6 81.0 57.4
Regulatory assessments 54.9 22.4 22.6 23.1 19.5 18.0
Operating supplies 44.3 48.7 54.0 53.2 46.8 39.8
Merger expense 13.4 - - 98.6 28.4 -
Net loss on extinguishment of debt 11.7 9.8 11.7 - - -
Visa litigation (33.5) 76.9 ----
Other expense 326.2 377.3 347.5 341.0 297.0 219.2
Total noninterest expense $5,890.4 $5,233.8 $4,879.9 $4,690.7 $3,897.0 $3,400.6
Noninterest Expense
Noninterest expense increased by $656.6 million, or 12.5%, in 2008 compared to 2007. This was primarily the result of
increased costs of $624.9 million associated with the current credit cycle compared to 2007 along with a $183.4 million
contribution of Coke common stock that we made to our charitable foundation in the third quarter of 2008. The remaining
components of noninterest expense decreased on an overall basis because of the success achieved in reducing expenses
through our E2Program.
Personnel expenses in 2008 decreased $9.0 million, or 0.3%, from the same period in 2007. The decrease in personnel
expense is due primarily to the decline in salaries expense of $34.8 million from 2007 to 2008 reflecting a reduction of
approximately 3,000 full time equivalent employees since December 31, 2007 to 29,333 as of December 31, 2008. Due
primarily to our fair value election for certain mortgage loans held for sale beginning in May of 2007, we deferred $79.7
million less in loan origination costs in 2008 than 2007, which partially offset the decline in personnel expense. As a
consequence of the current market conditions and the reduction in plan participants, expense related to incentive plans was
also lower by $53.9 million. In addition, to mitigate increases in personnel expenses in 2009, the following initiatives have
been employed: no merit increases for senior management, comprising over 4,000 people, the lowering of average raise
targets for the remainder of the workforce by one-third, and a reduction in the amount of promotional salary increases.
Credit-related costs include operating losses, credit and collection services, other real estate expense, and mortgage
reinsurance expense. These expenses increased $624.9 million, or 238.2%, over 2007. Operating losses increased $312.2
million, or 233.0%, compared to 2007. These increases include a $206.9 million reserve recorded during 2008 for borrower
misrepresentations and insurance claim denials. Approximately $139 million of this reserve relates to insured prime second
lien loans and home equity lines of credit. Other real estate expense increased $88.9 million, or 562.7%, in 2008 compared to
2007. This increase was due to a $316.7 million, or 172.4%, increase in other real estate holdings, coupled with additional
valuation losses in 2008 on residential loan-related properties as a result of increased inventory of foreclosures and
deteriorating home values. Credit and collection services expense increased $43.9 million, or 39.0%, in 2008 compared to
2007 due to increased collection and loss mitigation activity offset by decreased loan closing expenses.
Marketing and customer development expense increased $177.2 million, or 90.9%, in 2008, compared to the same period in
2007. The increase was due to our contribution of $183.4 million, in the form of 3.6 million shares of Coke common stock, to
our charitable foundation in the third quarter of 2008. Additionally, media advertising increased during the fourth quarter of
2008, when compared to 2007, in relation to our “Live Solid. Bank Solid.” campaign.
Mortgage reinsurance expense increased $179.9 million in 2008 compared to 2007 due to an increase in the mortgage
reinsurance reserve which pertains to our mortgage reinsurance guaranty subsidiary, Twin Rivers. This increase in reserves
was due primarily to the declining credit performance of the underlying loans. Twin Rivers’ loss exposure arises from third
27