SunTrust 2008 Annual Report Download - page 54
Download and view the complete annual report
Please find page 54 of the 2008 SunTrust annual report below. You can navigate through the pages in the report by either clicking on the pages listed below, or by using the keyword search tool below to find specific information within the annual report.-
 1
1 -
2
-
3
-
4
-
5
-
6
-
7
-
8
-
9
-
10
-
11
-
12
-
13
-
14
-
15
-
16
-
17
-
18
-
19
-
20
-
21
-
22
-
23
-
24
-
25
-
26
-
27
-
28
-
29
-
30
-
31
-
32
-
33
-
34
-
35
-
36
-
37
-
38
-
39
-
40
-
41
-
42
-
43
-
 44
44 -
 45
45 -
 46
46 -
 47
47 -
 48
48 -
 49
49 -
 50
50 -
 51
51 -
 52
52 -
 53
53 -
 54
54 -
 55
55 -
 56
56 -
 57
57 -
 58
58 -
 59
59 -
 60
60 -
 61
61 -
 62
62 -
 63
63 -
 64
64 -
65
-
66
-
67
-
68
-
69
-
70
-
71
-
72
-
73
-
74
-
75
-
76
-
77
-
78
-
79
-
80
-
81
-
82
-
83
-
84
-
85
-
86
-
87
-
88
-
89
-
90
-
91
-
92
-
93
-
94
-
95
-
96
-
97
-
98
-
99
-
100
-
101
-
102
-
103
-
104
-
105
-
106
-
107
-
108
-
109
-
110
-
111
-
112
-
113
-
114
-
115
-
116
-
117
-
118
-
119
-
120
-
121
-
122
-
123
-
124
-
125
-
126
-
127
-
128
-
129
-
130
-
131
-
132
-
133
-
134
-
135
-
136
-
137
-
138
-
139
-
140
-
141
-
142
-
143
-
144
-
145
-
146
-
147
-
148
-
149
-
150
-
151
-
152
-
153
-
154
-
155
-
156
-
157
-
158
-
159
-
160
-
161
-
162
-
163
-
164
-
165
-
166
-
167
-
168
-
169
-
170
-
171
-
172
-
173
-
174
-
175
-
176
-
177
-
178
-
179
-
180
-
181
-
182
-
183
-
184
-
185
-
186
-
187
-
188
 |
 |

process involves the gathering of multiple sources of information, including broker quotes, values provided by pricing
services, trading activity in other similar securities, market indices, and internal cash flow and pricing matrix estimates.
Participation on this working group includes the business or functional area that manages the instrument, market risk, and
finance, including the independent price verification function. Pricing estimates are derived on most illiquid instruments
weekly and at a minimum monthly, and the working group formally reviews the pricing information at least quarterly. These
reviews also include assessing an instrument’s classification in the fair value hierarchy based on the significance of the
unobservable assumptions used to estimate the fair value.
We used significant unobservable inputs (level 3) to fair value certain trading assets, securities available for sale, portfolio
loans accounted for at fair value, interest rate lock commitments (“IRLCs”), loans held for sale, derivatives, and public debt.
The table below discloses financial instruments that have been impacted by level 3 fair value determinations.
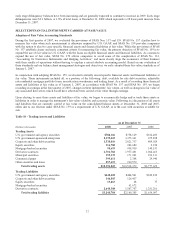
Table 12
As of
(Dollars in millions) December 31, 2008 December 31, 2007
Trading assets $1,391.4 $2,950.1
Securities available for sale 1,489.6 869.7
Loans held for sale 487.4 481.3
Loans 270.3 220.8
IRLCs 173.6 -
Total level 3 assets $3,712.3 $4,521.9
Total assets $189,138.0 $179,573.9
Total assets measured at fair value $32,897.2 $33,397.8
Level 3 assets as a percent of total assets 2.0 % 2.5 %
Level 3 assets as a percent of total assets measured at fair value 11.3 13.5
Long-term debt $3,496.3 $-
IRLCs 11.2 19.6
Total level 3 liabilities $3,497.5 $19.6
Total liabilities $166,749.9 $161,521.4
Total liabilities measured at fair value $11,456.5 $9,897.9
Level 3 liabilities as a percent of total liabilities 2.1 %-%
Level 3 liabilities as a percent of total liabilities measured at fair value 30.5 0.2
1Beginning in the first quarter of 2008, we classified IRLCs on residential mortgage loans held for sale on a gross basis within other
liabilities and other assets.
Securities Available for Sale and Trading Assets
Our level 3 securities available for sale include instruments totaling approximately $1.5 billion at December 31, 2008
including FHLB and Federal Reserve Bank stock, as well as certain municipal bond securities, which are only
redeemable with the issuer at par and cannot be traded in the market; as such, no significant observable market data for
these instruments is available. These nonmarketable securities total approximately $934 million at December 31, 2008.
Level 3 trading assets total approximately $1.4 billion at December 31, 2008, which includes the Coke common stock
forward sale derivative valued at approximately $249.5 million at December 31, 2008, as well as approximately $674
million of Small Business Administration (“SBA”) loans and pooled securities whose payment is guaranteed by the U.S.
government. The remaining level 3 securities, both trading assets and available for sale securities, totals approximately
$1 billion at December 31, 2008 and are predominantly residual and other interests retained from Company-sponsored
participations or securitizations of commercial loans and residential mortgage loans, investments in SIVs, and MBS and
ABS collateralized by a variety of underlying assets including residential mortgages, corporate obligations, and
commercial real estate for which little or no market activity exists or whose value of the underlying collateral is not
market observable. We have also increased our exposure to bank trust preferred ABS, student loan ABS, and municipal
securities as a result of our offer to purchase certain ARS as a result of failed auctions. While the majority of the
collateral in the remaining level 3 securities continues to be residential mortgages, exposure is widely spread across
prime first and second lien mortgages, as well as subprime first and second lien mortgages that were originated from
2003 through 2007.
42