SunTrust 2008 Annual Report Download - page 81
Download and view the complete annual report
Please find page 81 of the 2008 SunTrust annual report below. You can navigate through the pages in the report by either clicking on the pages listed below, or by using the keyword search tool below to find specific information within the annual report.FOURTH QUARTER RESULTS
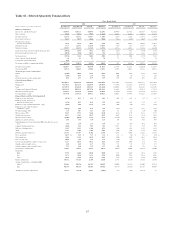
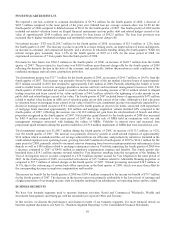
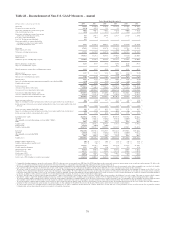
We reported a net loss available to common shareholders of $379.2 million for the fourth quarter of 2008, a decrease of
$382.5 million compared to the same period of the prior year. Diluted loss per average common share was $1.08 for the
fourth quarter of 2008 compared to diluted income of $0.01 for the fourth quarter of 2007. The fourth quarter of 2008 results
included net market valuation losses on illiquid financial instruments and our public debt and related hedges carried at fair
value of approximately $144.6 million and a provision for loan losses of $962.5 million. The loan loss provision was
increased due to higher residential mortgage and residential construction net charge-offs.
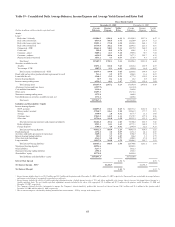
Net interest income—FTE was $1,208.7 million for the fourth quarter of 2008, an increase of $13.9 million, or 1.2%, from
the fourth quarter of 2007. The increase was due to growth in average earning assets, an improved mix of loans and deposits,
an increase in consumer and commercial deposits, and a decrease in wholesale funding during the fourth quarter. While net
interest margin grew nominally from 3.13% in the fourth quarter of 2007 to 3.14% for the same period of 2008, we
experienced an increase of 7 basis points from the third quarter of 2008.
Provision for loan losses was $962.5 million in the fourth quarter of 2008, an increase of $605.7 million from the fourth
quarter of 2007. The provision for loan losses was $410.0 million more than net charge-offs for the fourth quarter of 2008
reflecting the dramatic decline in the state of the economy and, specifically, further deterioration in credit conditions of the
residential mortgage and real estate construction portfolios.
Total noninterest income was $717.7 million for the fourth quarter of 2008, an increase of $141.7 million, or 24.6%, from the
fourth quarter of 2007. This increase was primarily driven by the impact of the net market valuation losses of approximately
$555 million recorded in 2007 that declined to approximately $145 million in 2008. Partially offsetting the benefit of lower
mark to market losses was lower mortgage production income and trust and investment management revenue in 2008. The
fourth quarter of 2008 included net mark to market valuation losses in trading income of $43.6 million related to illiquid
trading securities and loans carried at fair value and losses of $44.3 million related to the tightening of credit spreads on our
public debt and related hedges carried at fair value. The fourth quarter of 2007 included losses of approximately $475 million
related to market value declines in ABS, net of valuation gains on our debt carried at fair value. Although we had a decrease
in valuation losses on mortgage loans carried at fair value or held for sale, noninterest income was negatively impacted by a
decline in mortgage-related income of $50.1 million in the fourth quarter as reserves for losses associated with repurchases
of mortgage loans increased approximately $32 million and mortgage origination volume declined 44% compared to the
fourth quarter of 2007. Offsetting the increase was a $118.8 million net gain from the sale/leaseback of branch and office
properties recognized in the fourth quarter of 2007. Net securities gains/(losses) for the fourth quarter of 2008 also increased
by $405.4 million compared to the same period of 2007 due to the sale of MBS held in conjunction with our risk
management strategies associated with hedging the values of MSRs. Volatility in interest rates and increased loan
prepayment speed estimates during the quarter resulted in a $370.0 million impairment of MSRs that were amortized at cost.
Total noninterest expense was $1,588.7 million during the fourth quarter of 2008, an increase of $133.3 million, or 9.2%,
over the fourth quarter of 2007. The increase was primarily driven by growth in credit-related expenses of approximately
$334 million which overshadowed the cost savings achieved from our efficiency and productivity initiatives. Included in the
credit-related expenses were operating losses, growing from $42.8 million for fourth quarter of 2007 to $236.1 million for the
same period of 2008, primarily related to increased reserves stemming from borrower misrepresentations and insurance claim
denials, as well as $100 million related to mortgage reinsurance reserves. Positively impacting the fourth quarter of 2008 was
a decrease compared to 2007 of $44.8 million in employee compensation expense and benefits. The fourth quarter also
benefited from a $14.3 million expense reversal related to Visa litigation, resulting from the recognition of the funding by
Visa of its litigation escrow account, compared to a $76.9 million expense accrual for Visa litigation in the same period of
2007. In the fourth quarter of 2008, we recorded write-downs of $15.7 million related to Affordable Housing properties as
compared to $57.7 million of related charges in the fourth quarter of 2007. Outside processing increased $38.5 million, or
36.5%, due to the outsourcing of certain back-office operations in the third quarter of 2008, which was more than offset by
the corresponding decrease in employee compensation and benefits.
The income tax benefit for the fourth quarter of 2008 was $309.0 million compared to the income tax benefit of $79.7 million
for the fourth quarter of 2007. The decrease in the tax provision was primarily attributable to the lower level of earnings and
a higher proportion of tax-exempt income, state tax benefits resulting from subsidiaries’ net operating losses and tax credits.
BUSINESS SEGMENTS
We have four business segments used to measure business activities: Retail and Commercial, Wholesale, Wealth and
Investment Management, and Mortgage with the remainder in Corporate Other and Treasury.
In this section, we discuss the performance and financial results of our business segments. For more financial details on
business segment disclosures, see Note 22, “Business Segment Reporting” to the Consolidated Financial Statements.
69


